
How Crypto Market Analysis Is Evolving in 2026: On-Chain, Funding, Liquidations and Sentiment Tools
By Mag-Info Tech editorial · 2026-06-10

Why market analysis is shifting in 2026
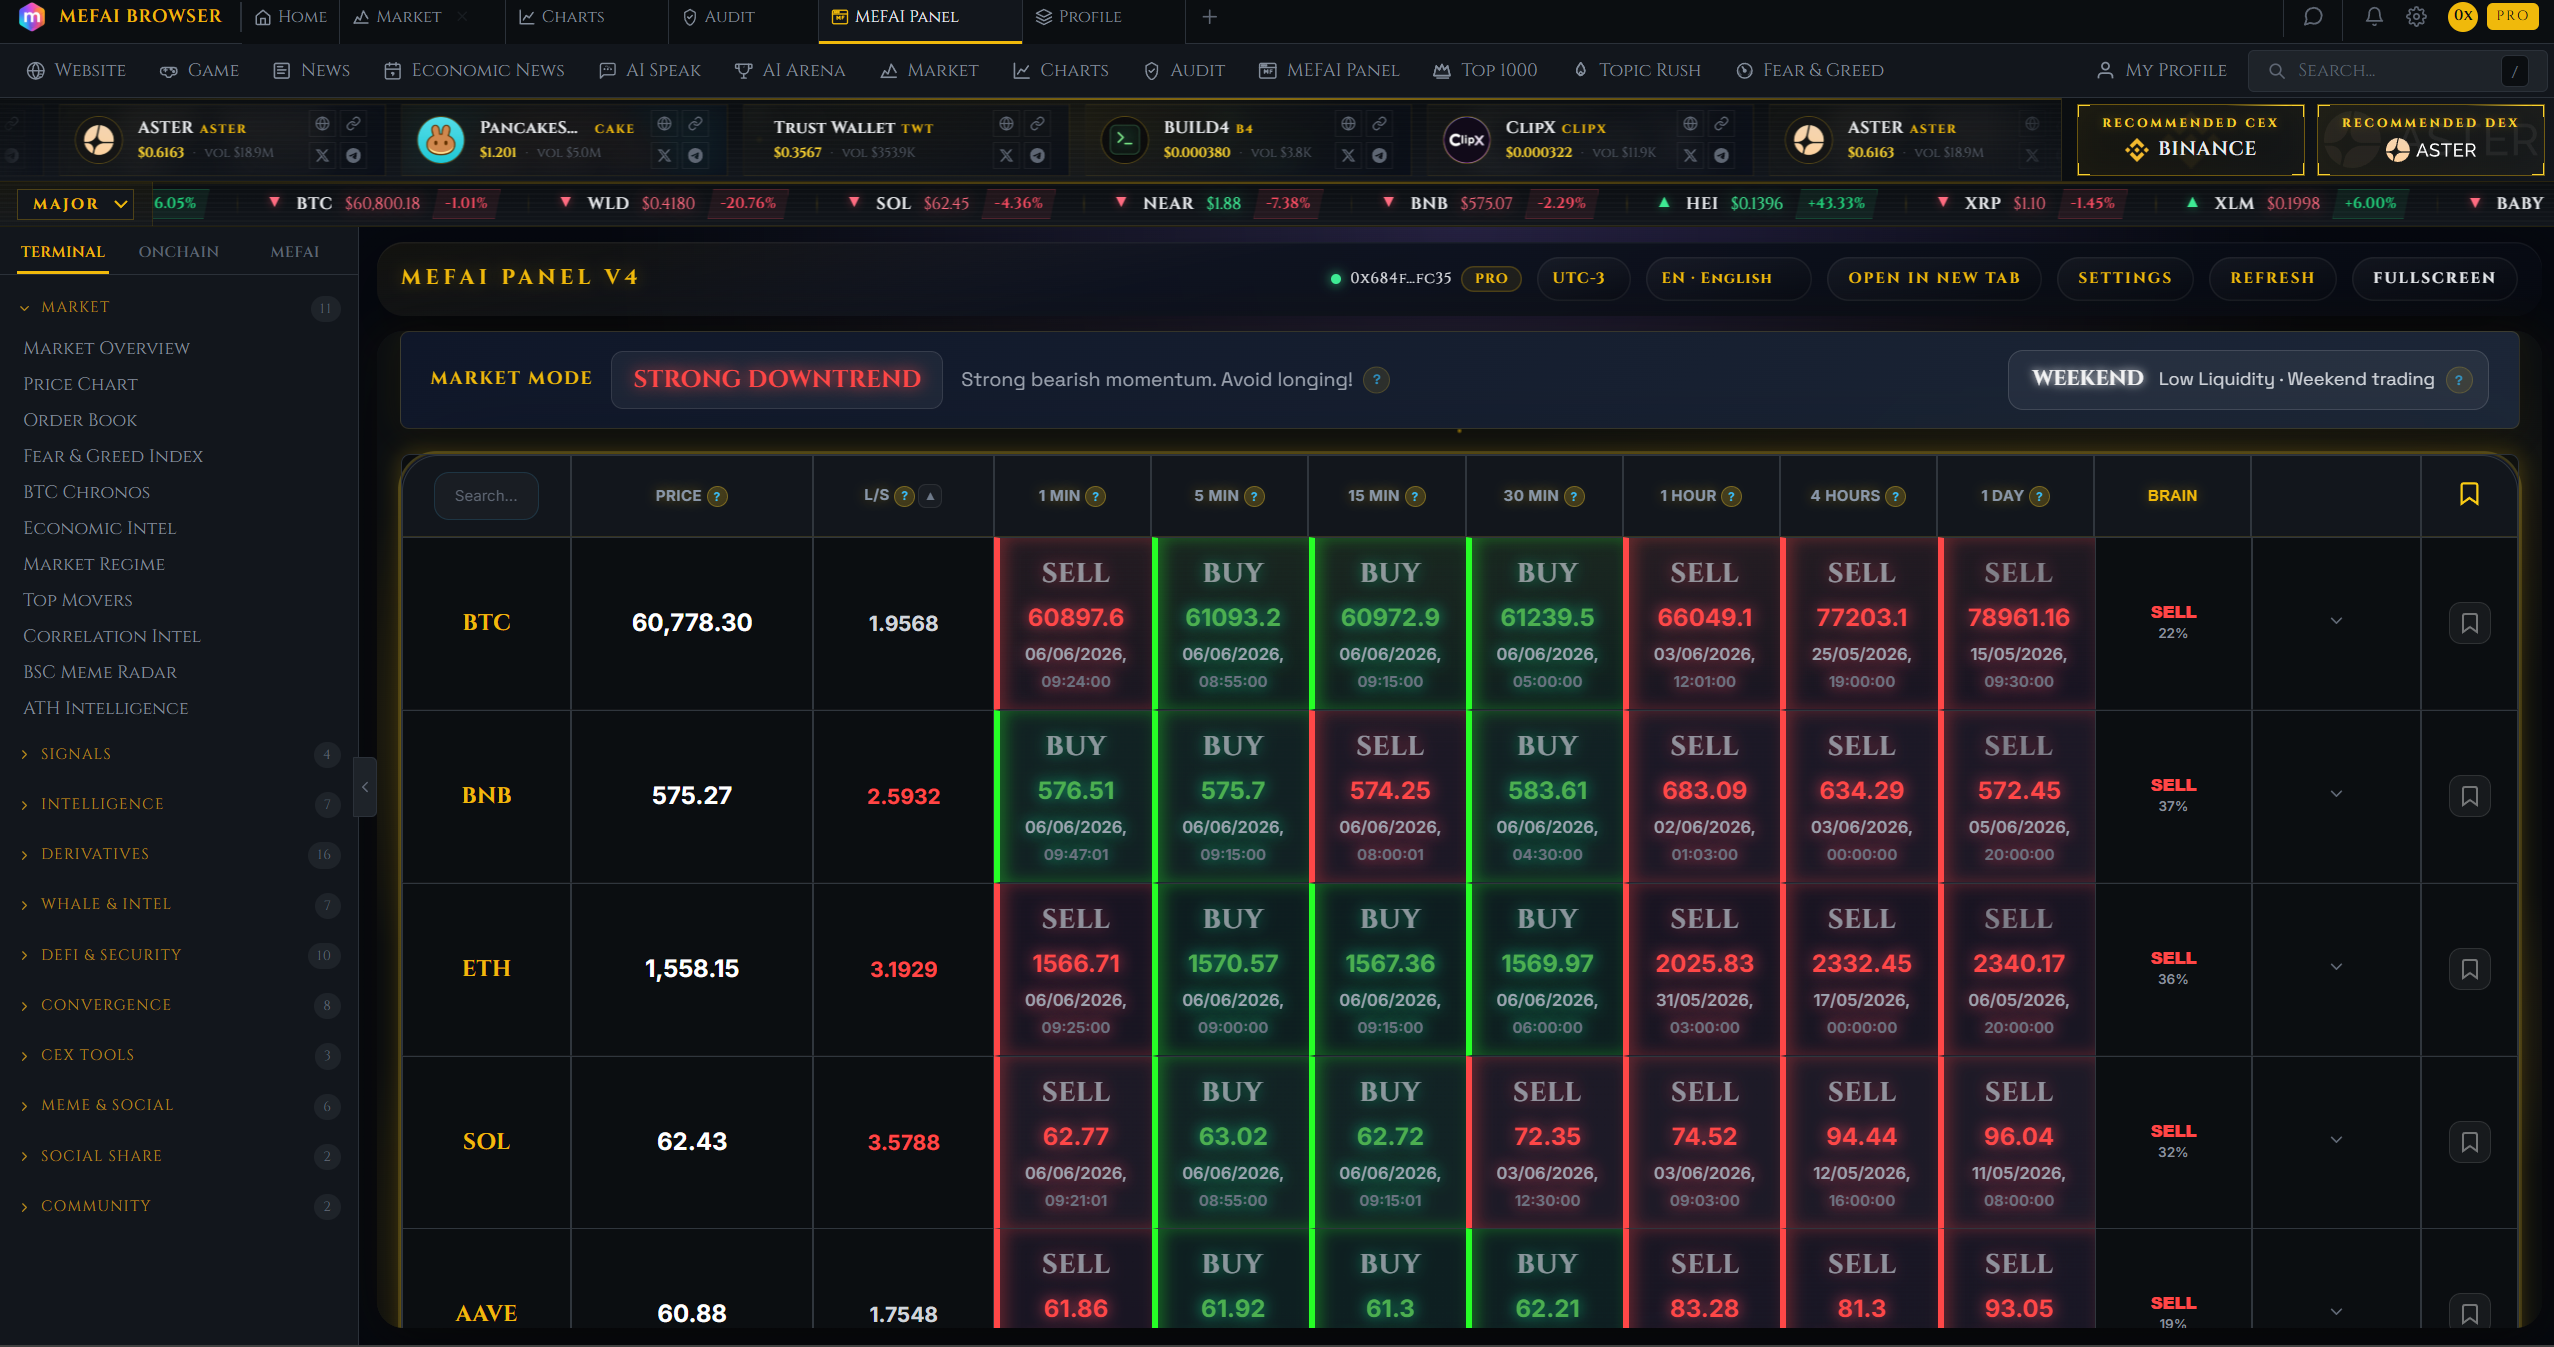
Crypto markets now move faster than ever, but the raw data that matters hasn’t changed: where coins and tokens are stored, who is paying to hold leveraged positions, which large trades are being liquidated, and what the crowd is saying. What has changed is the speed, scope and integration of the tools that surface that data. In 2026, four analytical pillars have solidified: on-chain data platforms that map wallet flows at a granular level, perpetual-futures funding-rate trackers that reveal speculative heat, liquidation dashboards that flag forced-exit cascades in real time, and sentiment engines that filter social chatter into tradable signals. Together, these tools aim to turn fragmented blockchain events into coherent, actionable views of market structure.
This evolution matters because it shifts the advantage from those who merely watch price candles to those who can interpret the underlying forces that create them. A sudden spike in leveraged long liquidations on a major exchange can precede a local top; a sustained rise in funding rates across perpetual markets can signal euphoria before a reversal. The tools below are the ones traders and analysts consistently turn to when they need to separate signal from noise.
On-chain data platforms: from block explorers to multi-chain asset maps
Blockchain explorers were once the only way to peek at on-chain activity, but today’s platforms ingest terabytes of transaction data and render it into interactive dashboards. The leaders in 2026 let users trace wallet flows across Ethereum, Solana, Arbitrum, Optimism and Bitcoin L2s without switching tabs, highlight accumulation patterns by large entities, and flag contract interactions that precede price moves. Some platforms now overlay derivatives open interest with on-chain activity to show whether inflows are going into spot or futures, while others offer programmable alerts for unusual deposit or withdrawal spikes.
For analysts who need to confirm whether a rally is backed by real buying, these tools are indispensable. They remove the guesswork around exchange-reported volumes by showing where coins actually reside and how they are moving. Practitioners typically start with a broad view—total value locked in DeFi, exchange net flows, or whale wallet movements—and then drill down into specific protocols or token contracts. The most advanced dashboards also integrate MEV capture data and validator behavior, giving a fuller picture of who is setting prices and why.

Perpetual funding monitors: measuring speculative heat across exchanges
Perpetual futures have become the dominant venue for crypto leverage, and their funding mechanism—hourly cash settlements between longs and shorts—has emerged as a reliable thermometer of market sentiment. In 2026, funding-rate trackers ingest data from dozens of exchanges, normalize it for leverage differences, and present it as a single heat map. High and rising funding across major pairs signals that longs are paying shorts to stay open, indicating exuberance and potential over-extension. Conversely, negative and falling funding can precede short squeezes or mean-reversion rallies.
Traders use these tools in two ways. First, they watch for regime shifts: when funding flips from positive to negative across multiple exchanges, it often coincides with local price reversals. Second, they compare funding rates across similar pairs (e.g., BTC-PERP on Binance versus Bybit) to detect mispricings or arbitrage opportunities. The best dashboards also overlay order-book depth and liquidation heatmaps so users can see whether high funding is supported by real liquidity or fragile leverage.
Liquidation trackers: spotting forced-exit cascades before they happen
Liquidation engines have evolved from simple bots that retweet liquidation tweets into sophisticated risk monitors that ingest order-book snapshots, margin rules and oracle prices from every major derivatives venue. In 2026, these tools deliver real-time heatmaps that show not just the size of liquidations but their leverage tier, the exchange where they occurred, and the tokens involved. More importantly, they let users set alerts for abnormal liquidation clusters—sudden bursts of $10 million+ in longs liquidated on ETH-PERP within minutes—before those events show up in price charts.
The practical value is clear: forced exits create cascades. When longs are liquidated, the selling pressure can push prices lower, triggering more liquidations in a feedback loop. Savvy traders monitor these clusters to anticipate short-term support or resistance levels and to adjust position sizing accordingly. Some platforms also simulate what a given liquidation wave would do to the order book, giving a probabilistic view of where the next bounce or breakdown might occur.
Sentiment engines: turning social noise into tradable signals
Social sentiment is no longer a side project for crypto analysts. In 2026, sentiment engines aggregate posts, replies and reactions across Twitter, Reddit, Telegram and Discord, then apply NLP models to classify messages by tone and topic. The best tools filter out spam and bot signals, weight messages by author influence, and output sentiment scores alongside price action. Some also integrate on-chain signals—whale wallet tags or large deposit alerts—to create a combined “market mood” indicator.

Real results from MEFAI's AI. Get $50 off the Pro plan.
Sponsored · Past performance is not indicative of future results. Not financial advice.
Traders use these scores in two ways. First, they look for divergences: rising prices with falling sentiment can signal a top, while falling prices with rising sentiment may hint at a bottom. Second, they use sentiment as a contrarian filter—extreme optimism often coincides with local peaks, while extreme pessimism can mark capitulation. The most advanced platforms now offer sentiment heatmaps by token and by chain, letting users compare mood across ecosystems in real time.

Which tool fits your trading style?
The right stack depends on your time horizon and risk tolerance. Short-term scalpers and day traders typically anchor on liquidation trackers and funding-rate heatmaps, because these show the immediate forces that move prices. Swing traders and macro analysts rely more on on-chain data and sentiment engines, since they need to understand whether a trend is backed by real capital or hype. Long-term investors use on-chain metrics to confirm accumulation or distribution patterns, while treating funding and liquidations as secondary confirmation.
A common mistake is to overload on tools without a clear workflow. A disciplined approach starts with one primary data source—say, an on-chain platform for asset flows—and layers in funding, liquidations and sentiment as corroborating signals. For example, if on-chain data shows steady accumulation by large wallets while funding rates are climbing into extreme territory, the trader can anticipate a potential short-term reversal rather than chasing the uptrend.
What to watch next: convergence and regulation
Two trends are reshaping the market-analysis landscape in 2026. First, convergence: platforms that once specialized in one pillar—on-chain, funding, liquidations or sentiment—are now merging datasets into unified dashboards. This reduces cognitive load and improves signal quality by eliminating blind spots. Second, regulation: as authorities tighten rules around derivatives data reporting, some funding-rate trackers now incorporate exchange-provided feeds alongside their own scrapers, improving accuracy but also increasing compliance overhead.
Watch for two developments in the coming quarters. First, the rise of cross-chain liquidity metrics that show how capital migrates between L1s and L2s in real time, giving early warnings of rotation trades. Second, the integration of AI-driven anomaly detection that flags unusual wallet behavior or funding spikes before they appear in traditional dashboards. Both could become standard features within a year.

Practical checklist: how to evaluate a tool in 2026
Start by defining your primary use case—day trading, swing trading or long-term allocation—and then score each tool against coverage, latency, integration and cost. Coverage means the number of exchanges, chains and derivatives markets included; latency refers to how quickly the tool updates after an on-chain or order-book event. Integration matters if you already use a trading terminal or portfolio tracker; some platforms offer APIs or direct plug-ins, while others remain standalone. Cost is now typically tiered by data depth and alert volume, so smaller traders can start with free or low-cost tiers before upgrading.
Always test a tool with your own market scenarios—simulate a funding spike, a whale deposit alert or a liquidation cascade—before committing real capital. The best platforms let you replay historical data so you can validate their signals against past market regimes. Finally, check whether the vendor provides documentation or educational content; the most durable tools are the ones whose creators explain not just the data, but the mechanics behind it.
Bottom line: the four pillars to watch
On-chain data, perpetual funding rates, liquidation heatmaps and sentiment engines have become the four pillars of crypto market analysis in 2026. Each pillar addresses a different layer of market structure—where coins are, who is paying to hold leveraged positions, where forced exits are happening, and what the crowd is saying. The tools that combine these pillars into a single workflow will give traders the clearest view of whether a move is backed by fundamentals or fragile leverage. As convergence accelerates and regulators tighten reporting standards, the gap between those who can interpret these signals quickly and those who cannot will only widen.
More in Crypto & Trading

DeFi Compared: Matching the Right Platform to Your Needs
A practical guide to the leading DeFi platforms, who each suits, what they offer, and how to choose based on your goals and risk tolerance.

Why an Anthropic IPO Could Tie Bitcoin Closer to the AI Trade
An Anthropic stock listing would give traders a single AI stock to bet on, tightening bitcoin’s correlation with the AI trade and increasing its sensitivity to Fed policy and risk appetite.
AI Crypto Trading Tools for Beginners: How to Get Started Safely
A no-nonsense beginner’s guide to AI crypto trading tools: what they do, how to start, and which beginner-friendly options to consider first.