
How to Choose Crypto Market Analysis Tools: 4 Common Mistakes and How to Avoid Them
By Mag-Info Tech editorial · 2026-06-10

Why the wrong market analysis tools lead to costly decisions
Choosing crypto market analysis tools is often treated as a quick software selection rather than a strategic decision that shapes every trade. New traders frequently prioritize flashy interfaces or influencer endorsements over data quality and context, which leads to overconfidence during volatile moves. Experienced traders also fall into traps when they assume that more data feeds automatically improve accuracy or that a single tool can cover every analytical need.
The core problem is that market analysis isn’t just about data points—it’s about understanding what those points mean in the current market cycle. On-chain, funding, liquidation and sentiment data each reveal different layers of market behavior. A tool that excels at funding rate tracking may be weak at liquidation forecasting, and a sentiment dashboard might miss critical on-chain shifts. Recognizing these gaps before committing to a tool can save months of inconsistent results.
Mistake 1: Treating all data feeds as equally reliable
Many traders assume that if a platform displays on-chain metrics, funding rates or liquidation data, the numbers are accurate and comparable across providers. This assumption overlooks differences in data sources, update frequencies and calculation methods. For example, funding rate calculations can vary between centralized exchanges and decentralized perpetual protocols, leading to conflicting signals during rapid price changes.
Another common error is relying solely on aggregated dashboards that blend multiple data sources without transparency about their methodologies. When metrics like exchange flows or miner outflows are combined without clear sourcing, traders risk reacting to noise rather than meaningful trends. The solution is to verify each provider’s data pipeline: look for documented methodologies, exchange coverage and update latency. Tools that publish their data sources and calculation formulas are preferable to black-box aggregators.
Practical takeaway: Before using any tool, check its methodology section or whitepaper. If it’s missing, treat the data as supplementary rather than primary. Cross-reference key metrics across two independent sources to confirm consistency before making trading decisions.
Mistake 2: Ignoring the context behind the metrics
Market analysis tools often present raw numbers—total value locked, funding rates, liquidation volumes—without explaining how these numbers relate to current market structure. For instance, a spike in liquidations might signal forced selling, but it could also reflect healthy market shakeouts after a rally. Similarly, rising funding rates can indicate growing leverage or mean that late longs are getting crowded out. Without context, traders misattribute cause and effect, leading to poor entries or exits.
Sentiment indicators are particularly prone to misinterpretation. Social media mentions or survey-based sentiment scores can swing wildly based on a single viral post or influencer tweet, creating false extremes. On-chain metrics like active addresses or exchange balances also need historical comparison to identify whether current values are normal, elevated or depressed relative to past cycles. Tools that provide comparative baselines—such as percentile rankings or z-scores—help contextualize raw data and reduce misreading.
Practical takeaway: Use tools that include historical comparisons and narrative context, such as annotated charts or analyst commentary. Avoid tools that only show absolute values without reference points. Pair numerical data with qualitative analysis from reputable market research platforms to validate signals.

Mistake 3: Over-reliance on a single data type
A common trap is assuming one category of data—such as funding rates or on-chain flows—can predict market direction on its own. Funding rates, for example, are excellent for gauging sentiment in perpetual futures markets, but they don’t account for spot market dynamics or macroeconomic shifts. Similarly, on-chain data like exchange inflows can signal potential selling pressure, but they don’t capture the impact of new derivatives products or institutional flows.
Sentiment tools, while useful for gauging crowd psychology, often lag real-time price action and can be manipulated by coordinated campaigns. Liquidation data, though highly predictive during volatile moves, offers little insight into longer-term trends. Traders who build strategies around a single data stream risk catastrophic blind spots during regime changes.
The solution is to combine multiple data types into a cohesive framework. A balanced toolkit might include: on-chain metrics for supply dynamics, funding rates for leverage sentiment, liquidation data for short-term pressure points, and sentiment dashboards for crowd behavior. Some platforms integrate these feeds into unified dashboards, while others require manual correlation.
Practical takeaway: Diversify your data sources intentionally. If your primary tool focuses on on-chain metrics, supplement it with a funding rate tracker and a liquidation feed. Use a spreadsheet or dashboard to correlate signals across tools before acting on them.
Mistake 4: Chasing real-time data at the cost of reliability
In fast-moving markets, the temptation to use the fastest, most granular data feeds is strong. However, real-time isn’t always reliable. Low-latency liquidation feeds or tick-level on-chain data can suffer from delays, errors or incomplete updates during network congestion. Some providers optimize for speed by sacrificing accuracy, leading to false signals during high volatility.
Another risk is data overload. Tools that stream every possible metric—from DEX volume to NFT trader counts—can overwhelm users with noise, making it harder to spot meaningful patterns. The result is analysis paralysis: too many signals, too little clarity. Reliable tools balance timeliness with stability, offering configurable update frequencies and alert thresholds.
Practical takeaway: Prioritize data quality and relevance over raw speed. Use real-time feeds only for time-sensitive decisions like liquidation cascades, and rely on slightly delayed but verified data for broader analysis. Set alerts based on meaningful thresholds rather than every minor fluctuation.
How to evaluate on-chain data providers
When assessing on-chain analytics platforms, focus on four criteria: coverage, methodology, update frequency and visualization. Coverage should include major chains and layer-2 networks relevant to your trading universe. Methodology matters—some platforms use proprietary algorithms to estimate exchange balances, which can introduce bias. Look for transparency about data sources and calculation methods.
Update frequency is critical for short-term traders. Some platforms update hourly, while others lag by days. Visualization should support both high-level overviews and deep dives into specific addresses or contracts. Tools like Glassnode, Nansen and Dune Analytics each have strengths: Glassnode excels at historical trend analysis, Nansen offers wallet-level insights, and Dune allows custom query creation for power users.
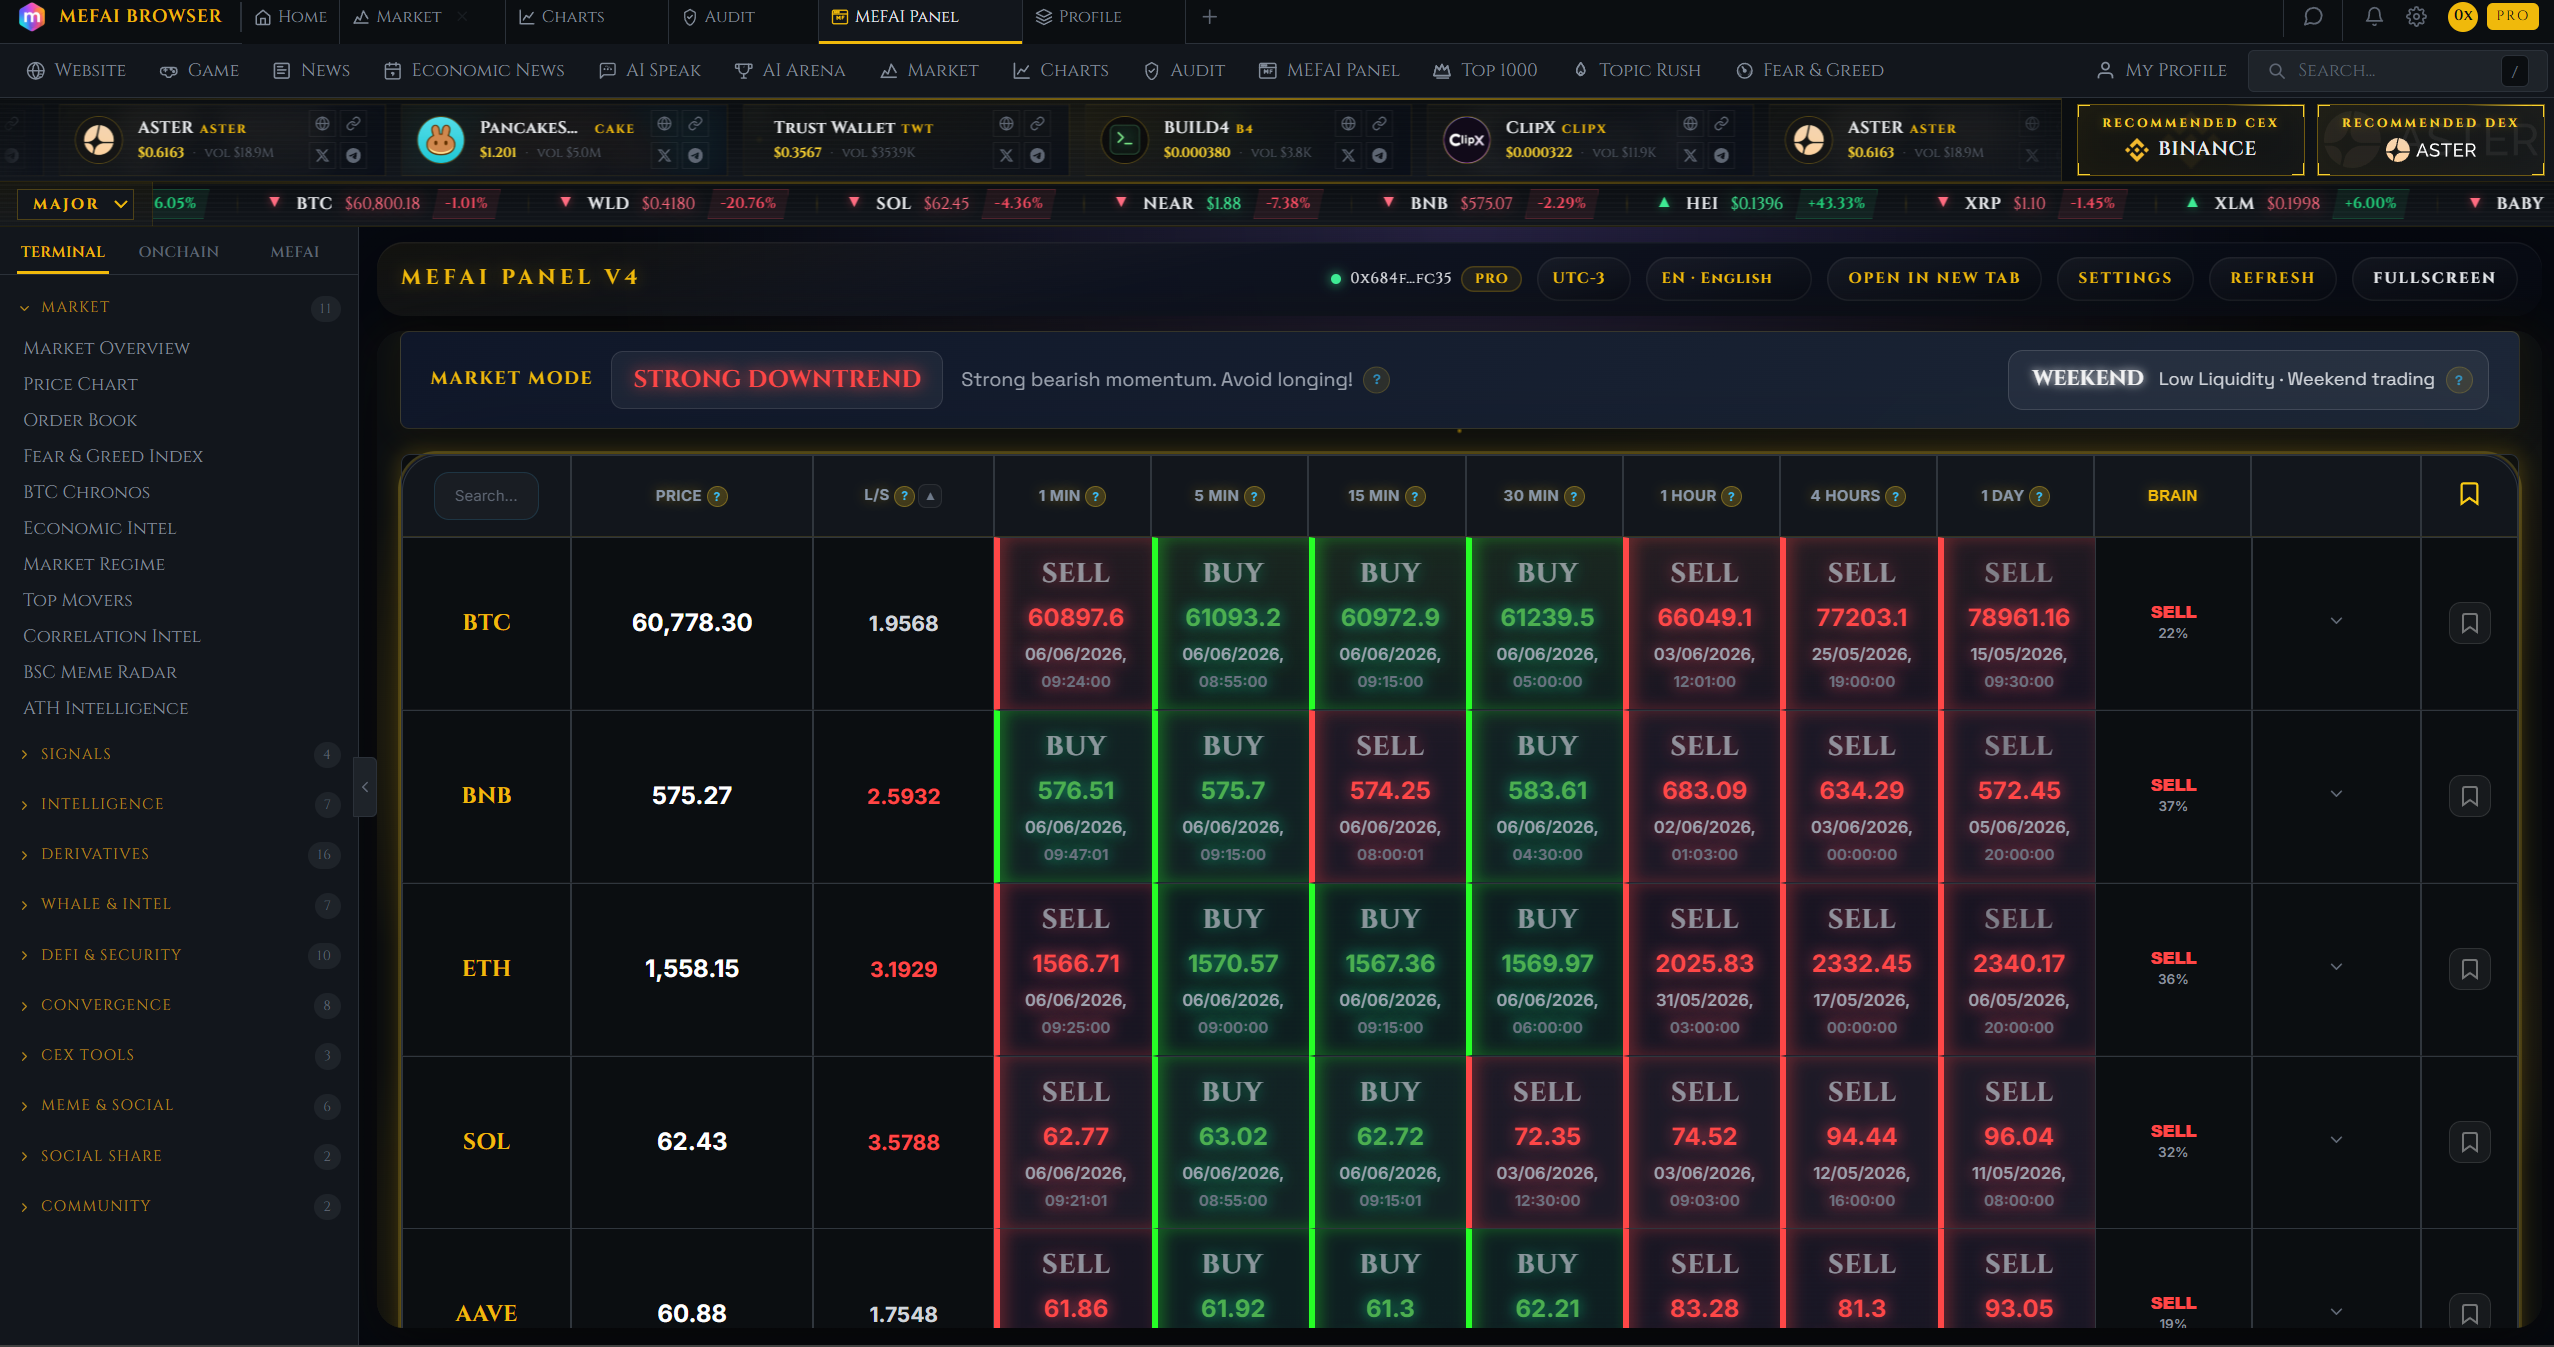
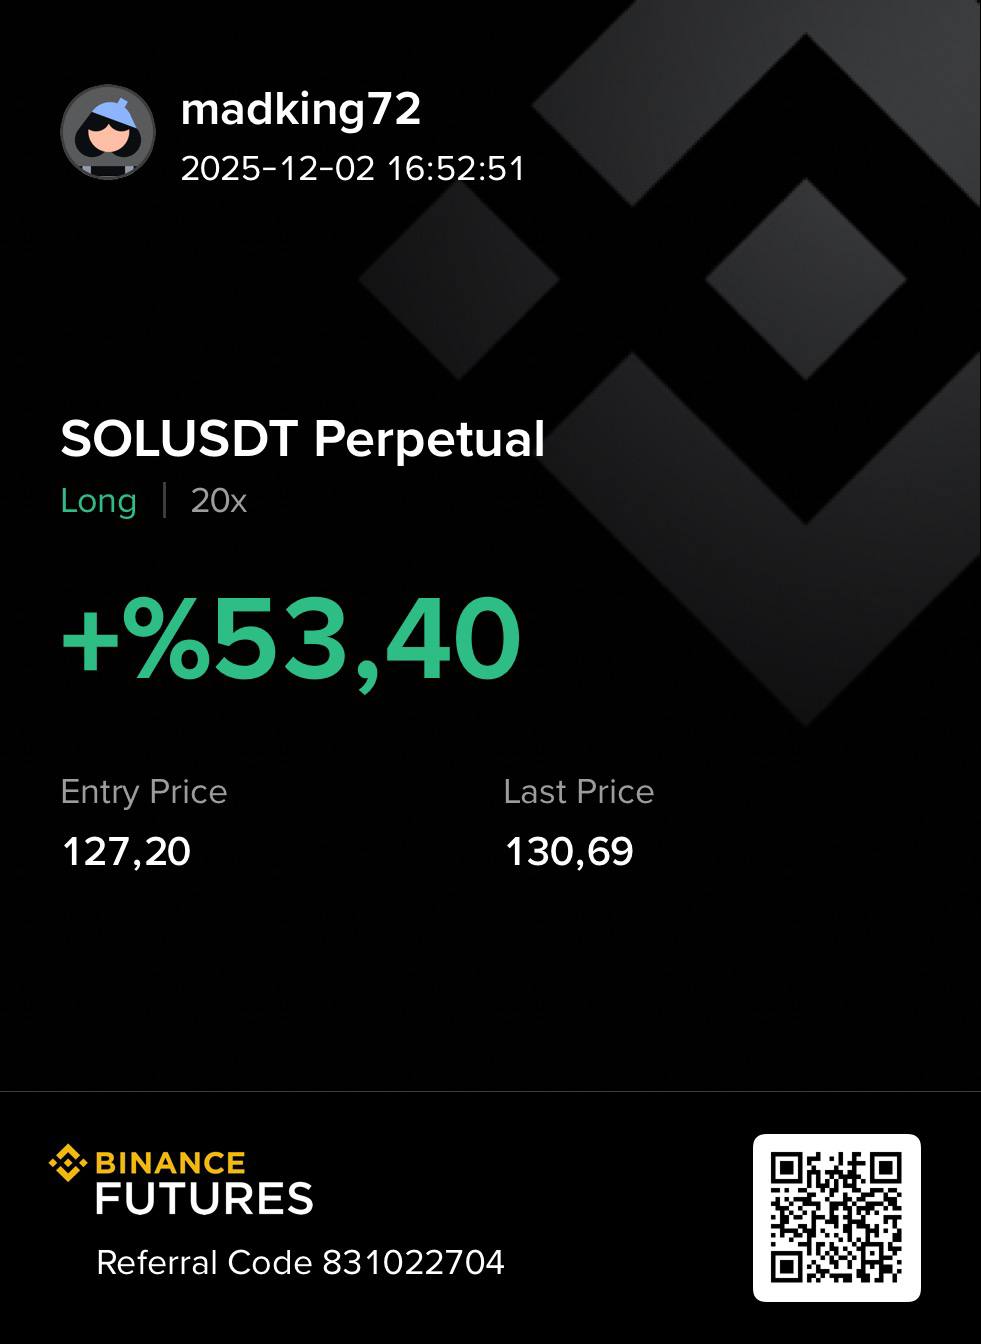

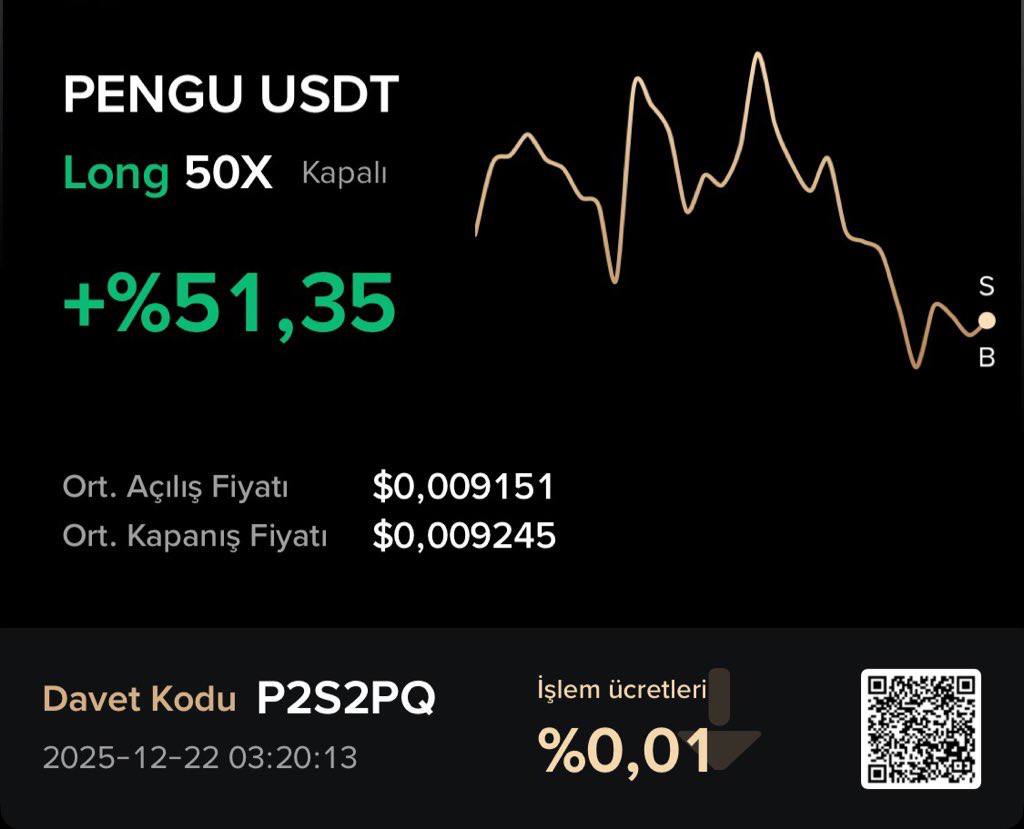
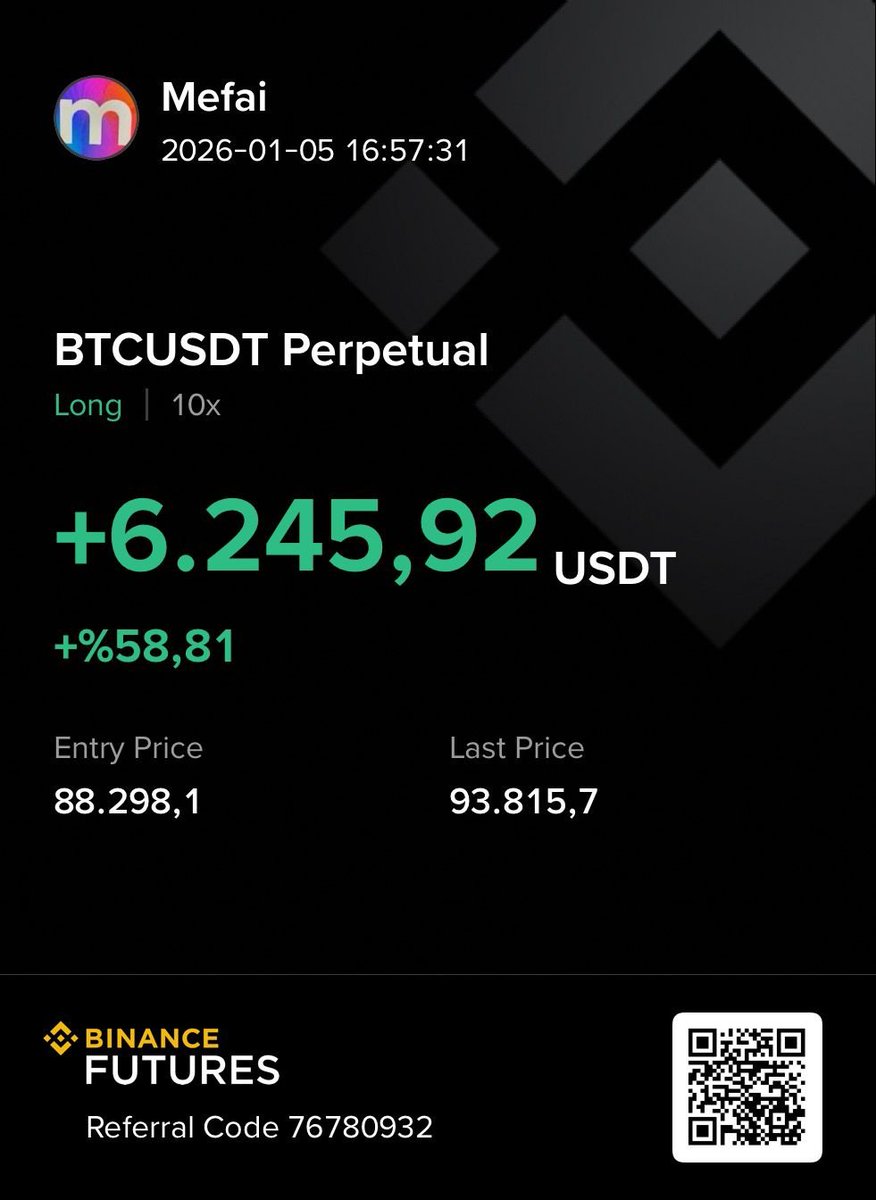
Real results from MEFAI's AI. Get $50 off the Pro plan.
Sponsored · Past performance is not indicative of future results. Not financial advice.

Practical takeaway: Start with a primary on-chain tool that matches your trading style. If you trade DeFi tokens, prioritize platforms with strong DEX and lending protocol coverage. For Bitcoin-focused strategies, choose tools with robust Bitcoin-native metrics. Test the platform’s alert system and export capabilities to ensure it fits into your workflow.
How to evaluate funding rate tools
Funding rate tools should track both current rates and cumulative funding across major perpetual exchanges. The best platforms differentiate between positive (longs pay shorts) and negative funding, and show historical trends to identify funding spikes or prolonged imbalances. Some tools also estimate the net open interest weighted funding rate, which helps gauge overall market leverage.
Avoid tools that only show current rates without context. For example, a funding rate of 0.05% per eight hours might seem low, but if it’s been rising for days, it indicates growing leverage. Conversely, a sudden drop in funding could signal deleveraging. Tools like Bybt and Coinalyze provide funding rate dashboards with exchange comparisons and historical charts.
Practical takeaway: Use funding rate tools to identify extremes in leverage sentiment. Set alerts for funding rate thresholds that historically precede trend reversals or continuation moves. Combine funding data with liquidation feeds to confirm whether leverage is being unwound or built up.
How to evaluate liquidation data feeds
Liquidation tools should provide real-time or near-real-time data on forced closures across multiple exchanges and derivatives types. Key features include breakdowns by long vs. short liquidations, exchange-specific data, and historical liquidation volumes. Some platforms also estimate unrealized profit and loss (PnL) of liquidated positions, which helps assess the impact on market sentiment.
Liquidation data is most useful during volatile periods. A spike in long liquidations often signals a market top, while a surge in short liquidations can indicate a bottom. However, liquidation data alone doesn’t predict direction—it reflects the outcome of price moves. Tools like Coinalyze and Skew offer liquidation dashboards with exchange coverage and historical comparisons.
Practical takeaway: Use liquidation feeds to confirm trend exhaustion or reversals, but don’t rely on them as standalone signals. Pair liquidation data with price action and funding rates to validate whether a move is sustainable or likely to reverse.
How to evaluate sentiment tools
Sentiment tools range from social media scrapers to survey-based platforms and news aggregators. The most reliable ones combine multiple signals—social volume, sentiment scores and news tone—into composite indices. Avoid tools that rely solely on Twitter or Reddit, as these platforms are prone to manipulation and echo chambers.
Look for sentiment tools that normalize data across platforms and timeframes. For example, a spike in Bitcoin mentions on Twitter might be driven by a single influencer, while a broader rise across multiple sources could indicate genuine interest. Tools like Santiment and LunarCrush provide sentiment dashboards with trend analysis and cross-platform comparisons.

Practical takeaway: Use sentiment tools to gauge market psychology, but treat them as contrarian indicators. Extreme sentiment often precedes reversals. Combine sentiment data with on-chain and derivatives metrics to confirm whether crowd behavior aligns with on-chain fundamentals.
Building a balanced analysis workflow
The most effective traders don’t just collect tools—they build a workflow that integrates multiple data streams into a coherent view. Start by defining your trading horizon: short-term scalping, swing trading or long-term investing. Each horizon requires different data emphases. Short-term traders may prioritize liquidation and funding data, while long-term investors focus on on-chain supply dynamics and network growth.
Next, establish a routine for reviewing data. Daily checks might include on-chain exchange flows and active addresses, while intraday monitoring focuses on funding rates and liquidations. Use alerts to flag anomalies, such as funding rate spikes or sudden liquidation waves. Finally, maintain a trading journal to record which signals proved reliable and which led to mistakes. Over time, this journal becomes a guide for refining your toolkit.
Practical takeaway: Design your workflow around your strengths and time constraints. If you trade part-time, use tools with strong alert systems and automated reports. If you’re full-time, invest in platforms that support deep customization and integration with your trading terminal.
Final checklist before committing to a tool
Before selecting any market analysis tool, run through this checklist:
- Does it cover the assets and chains you trade?
- Are its data sources and methodologies transparent?
- Does it provide historical context and comparisons?
- Can it integrate with your trading setup via API or alerts?
- Does it offer configurable thresholds to reduce noise?
- Is the pricing model sustainable for your budget?
If a tool fails any of these points, treat it as supplementary rather than core to your strategy.
Conclusion
Choosing crypto market analysis tools is less about picking the flashiest platform and more about building a reliable, context-aware framework. Avoid the four common mistakes—assuming data reliability, ignoring context, over-relying on one data type and chasing real-time noise—and you’ll reduce costly errors. The best tools aren’t the fastest or the most feature-rich; they’re the ones that fit your trading style, provide clear methodologies and integrate seamlessly into your workflow. Start with a focused toolkit, validate signals across sources, and refine your approach over time. In crypto’s fast-moving markets, clarity beats speed every time.
More in Crypto & Trading

DeFi Compared: Matching the Right Platform to Your Needs
A practical guide to the leading DeFi platforms, who each suits, what they offer, and how to choose based on your goals and risk tolerance.

Why an Anthropic IPO Could Tie Bitcoin Closer to the AI Trade
An Anthropic stock listing would give traders a single AI stock to bet on, tightening bitcoin’s correlation with the AI trade and increasing its sensitivity to Fed policy and risk appetite.

AI Crypto Trading Tools for Beginners: How to Get Started Safely
A no-nonsense beginner’s guide to AI crypto trading tools: what they do, how to start, and which beginner-friendly options to consider first.