
Crypto Market Analysis for Beginners: Where to Start with On-chain, Funding, Liquidations and Sentiment Tools
By Mag-Info Tech editorial · 2026-06-10

Why beginners need a structured approach to crypto market analysis
Newcomers to cryptocurrency often start by watching price charts and reacting to sudden moves. While price action matters, it’s only one piece of a much larger puzzle. A structured approach to market analysis helps you understand why prices move, not just that they move. For beginners, the most accessible entry points are on-chain data, funding rates, liquidations, and market sentiment. Each of these data types reveals different aspects of market behavior: on-chain data shows real user activity, funding rates indicate trader positioning in derivatives markets, liquidations highlight forced selling or buying, and sentiment tools reflect crowd psychology. Together, they form a beginner-friendly framework that reduces noise and highlights meaningful trends. Without this structure, it’s easy to misinterpret short-term volatility as a trend or miss early signals of a trend shift.
The key for beginners is to start with tools that are intuitive, reliable, and free or low-cost. Avoid jumping between dozens of dashboards or chasing premium features you don’t yet need. Instead, focus on tools that offer clear visualizations, educational content, and practical alerts. Over time, you can layer in more advanced tools, but the foundation should be built on transparency and repeatable workflows. This guide will walk you through the essential categories, recommend beginner-friendly tools for each, explain what to look for when choosing them, and show you how to combine them into a simple but effective market analysis routine.
Understand on-chain data: what real users are doing on the blockchain
On-chain data tracks wallet activity, transaction volumes, and token flows across blockchains. For beginners, the most useful on-chain metrics are active addresses, transaction volume, exchange inflows and outflows, and token supply distribution. Active addresses show how many unique wallets interact with a network each day, which can signal growing or declining interest. High transaction volume often correlates with increased network usage and can precede price rallies. Exchange inflows and outflows reveal whether users are moving assets to exchanges to sell or holding in self-custody, which can hint at upcoming selling pressure or accumulation. Supply distribution metrics, such as exchange balances or large holder concentrations, help you spot potential supply squeezes or selloffs.
When choosing an on-chain tool, prioritize platforms that present data in clear charts with minimal jargon. Look for historical comparisons so you can see how current activity compares to past cycles, and ensure the platform covers the blockchains you care about, such as Bitcoin and Ethereum. Some tools also offer alerts for unusual spikes in activity, which can help you spot emerging trends early. Beginners should avoid tools that require blockchain expertise to interpret the data; the goal is to understand what users are doing, not to audit the blockchain yourself. Start with platforms that offer ready-made dashboards for popular assets and provide educational explanations of each metric.
Funding rates: what derivatives traders expect from the market
Funding rates are periodic payments between long and short traders in perpetual futures markets. When funding is positive, longs pay shorts, indicating more bullish positioning; when negative, shorts pay longs, showing bearish sentiment. For beginners, funding rates act as a real-time pulse on sentiment in derivatives markets, which often lead spot markets during volatile periods. High positive funding can signal an overheated market prone to corrections, while deeply negative funding may indicate excessive bearishness and a potential reversal. However, funding alone should not drive decisions; it’s best used alongside other indicators to confirm trends or warn of reversals.
To use funding rates effectively, choose a platform that shows rates across major exchanges and assets in a single view. Beginners should focus on assets with deep liquidity and consistent funding data, such as Bitcoin and Ethereum. Avoid platforms that bury funding data in complex interfaces or require manual calculations. Look for tools that offer historical funding trends so you can compare current rates to past extremes. Also, pair funding data with price action to see if rising funding coincides with rising prices (potential uptrend) or falling prices (potential long squeeze). This combination helps you distinguish between healthy trends and speculative excess.
Liquidations: spotting forced selling or buying in real time
Liquidations occur when traders cannot meet margin requirements, forcing exchanges to close their positions automatically. These events create sharp, rapid price movements that can cascade across markets. For beginners, liquidation data acts as a heatmap of market stress: large liquidation clusters often precede or accelerate trend reversals, while isolated liquidations may just reflect routine volatility. Liquidations are especially useful in fast-moving markets like Bitcoin and Ethereum, where derivatives leverage amplifies price swings. Watching liquidation levels can help you anticipate short-term volatility and adjust risk management accordingly.
When selecting a liquidation tracker, prioritize platforms that display liquidations by size, direction (long or short), and price level. Some tools also overlay liquidation data on price charts, making it easier to see clusters relative to key support or resistance zones. Avoid tools that only show aggregate numbers without context, as the location and timing of liquidations matter more than the total count. Beginners should start with assets they already follow and use liquidation alerts to avoid entering trades during periods of high stress. Combining liquidation data with funding rates and on-chain activity can give you a clearer picture of whether a market is building up for a breakout or a reversal.
Sentiment tools: gauging crowd psychology and media narratives
Sentiment tools measure how people feel about the market by analyzing social media, news articles, and survey data. For beginners, sentiment provides a counterbalance to technical and on-chain data, highlighting when crowd psychology may be leaning too bullish or too bearish. High sentiment scores during price rallies can signal euphoria and a higher risk of pullbacks, while extremely low sentiment during downturns may indicate capitulation and a potential bottom. However, sentiment is noisy and often lags price moves, so it should be used as a confirming indicator rather than a primary signal.
To use sentiment tools effectively, choose platforms that aggregate data from multiple sources and present it in simple visual formats. Look for tools that show sentiment trends over time rather than single-point scores, so you can see whether sentiment is improving or deteriorating. Beginners should avoid tools that rely on proprietary algorithms that are hard to verify. Instead, use platforms that clearly explain their data sources and methodology. Combine sentiment readings with price action and on-chain data to avoid acting on fleeting emotions or short-lived spikes in chatter.
Beginner-friendly on-chain platforms to start with
For newcomers, platforms like Glassnode and Nansen offer curated on-chain dashboards that explain each metric in plain language. Glassnode is widely regarded for its educational content and historical comparisons, making it easy to see how current activity stacks up against past cycles. Nansen provides token-specific dashboards that highlight exchange flows, whale movements, and smart money activity, which can help you spot accumulation or distribution patterns. Both platforms offer free tiers with limited features, which is ideal for beginners who want to learn without committing to paid plans. When evaluating on-chain platforms, check whether they cover the blockchains you care about and whether their charts are easy to interpret without deep technical knowledge.
Another solid option is CryptoQuant, which focuses on exchange flows, miner flows, and derivatives data. Its platform is designed for clarity, with color-coded alerts for unusual activity such as large exchange inflows or rapid changes in miner reserves. CryptoQuant also offers a mobile app, which can be helpful for monitoring alerts on the go. Beginners should start by tracking a few key metrics—such as exchange net flow and active addresses—before exploring more advanced dashboards. Avoid tools that overwhelm you with too many metrics at once; the goal is to build intuition, not memorize data points.
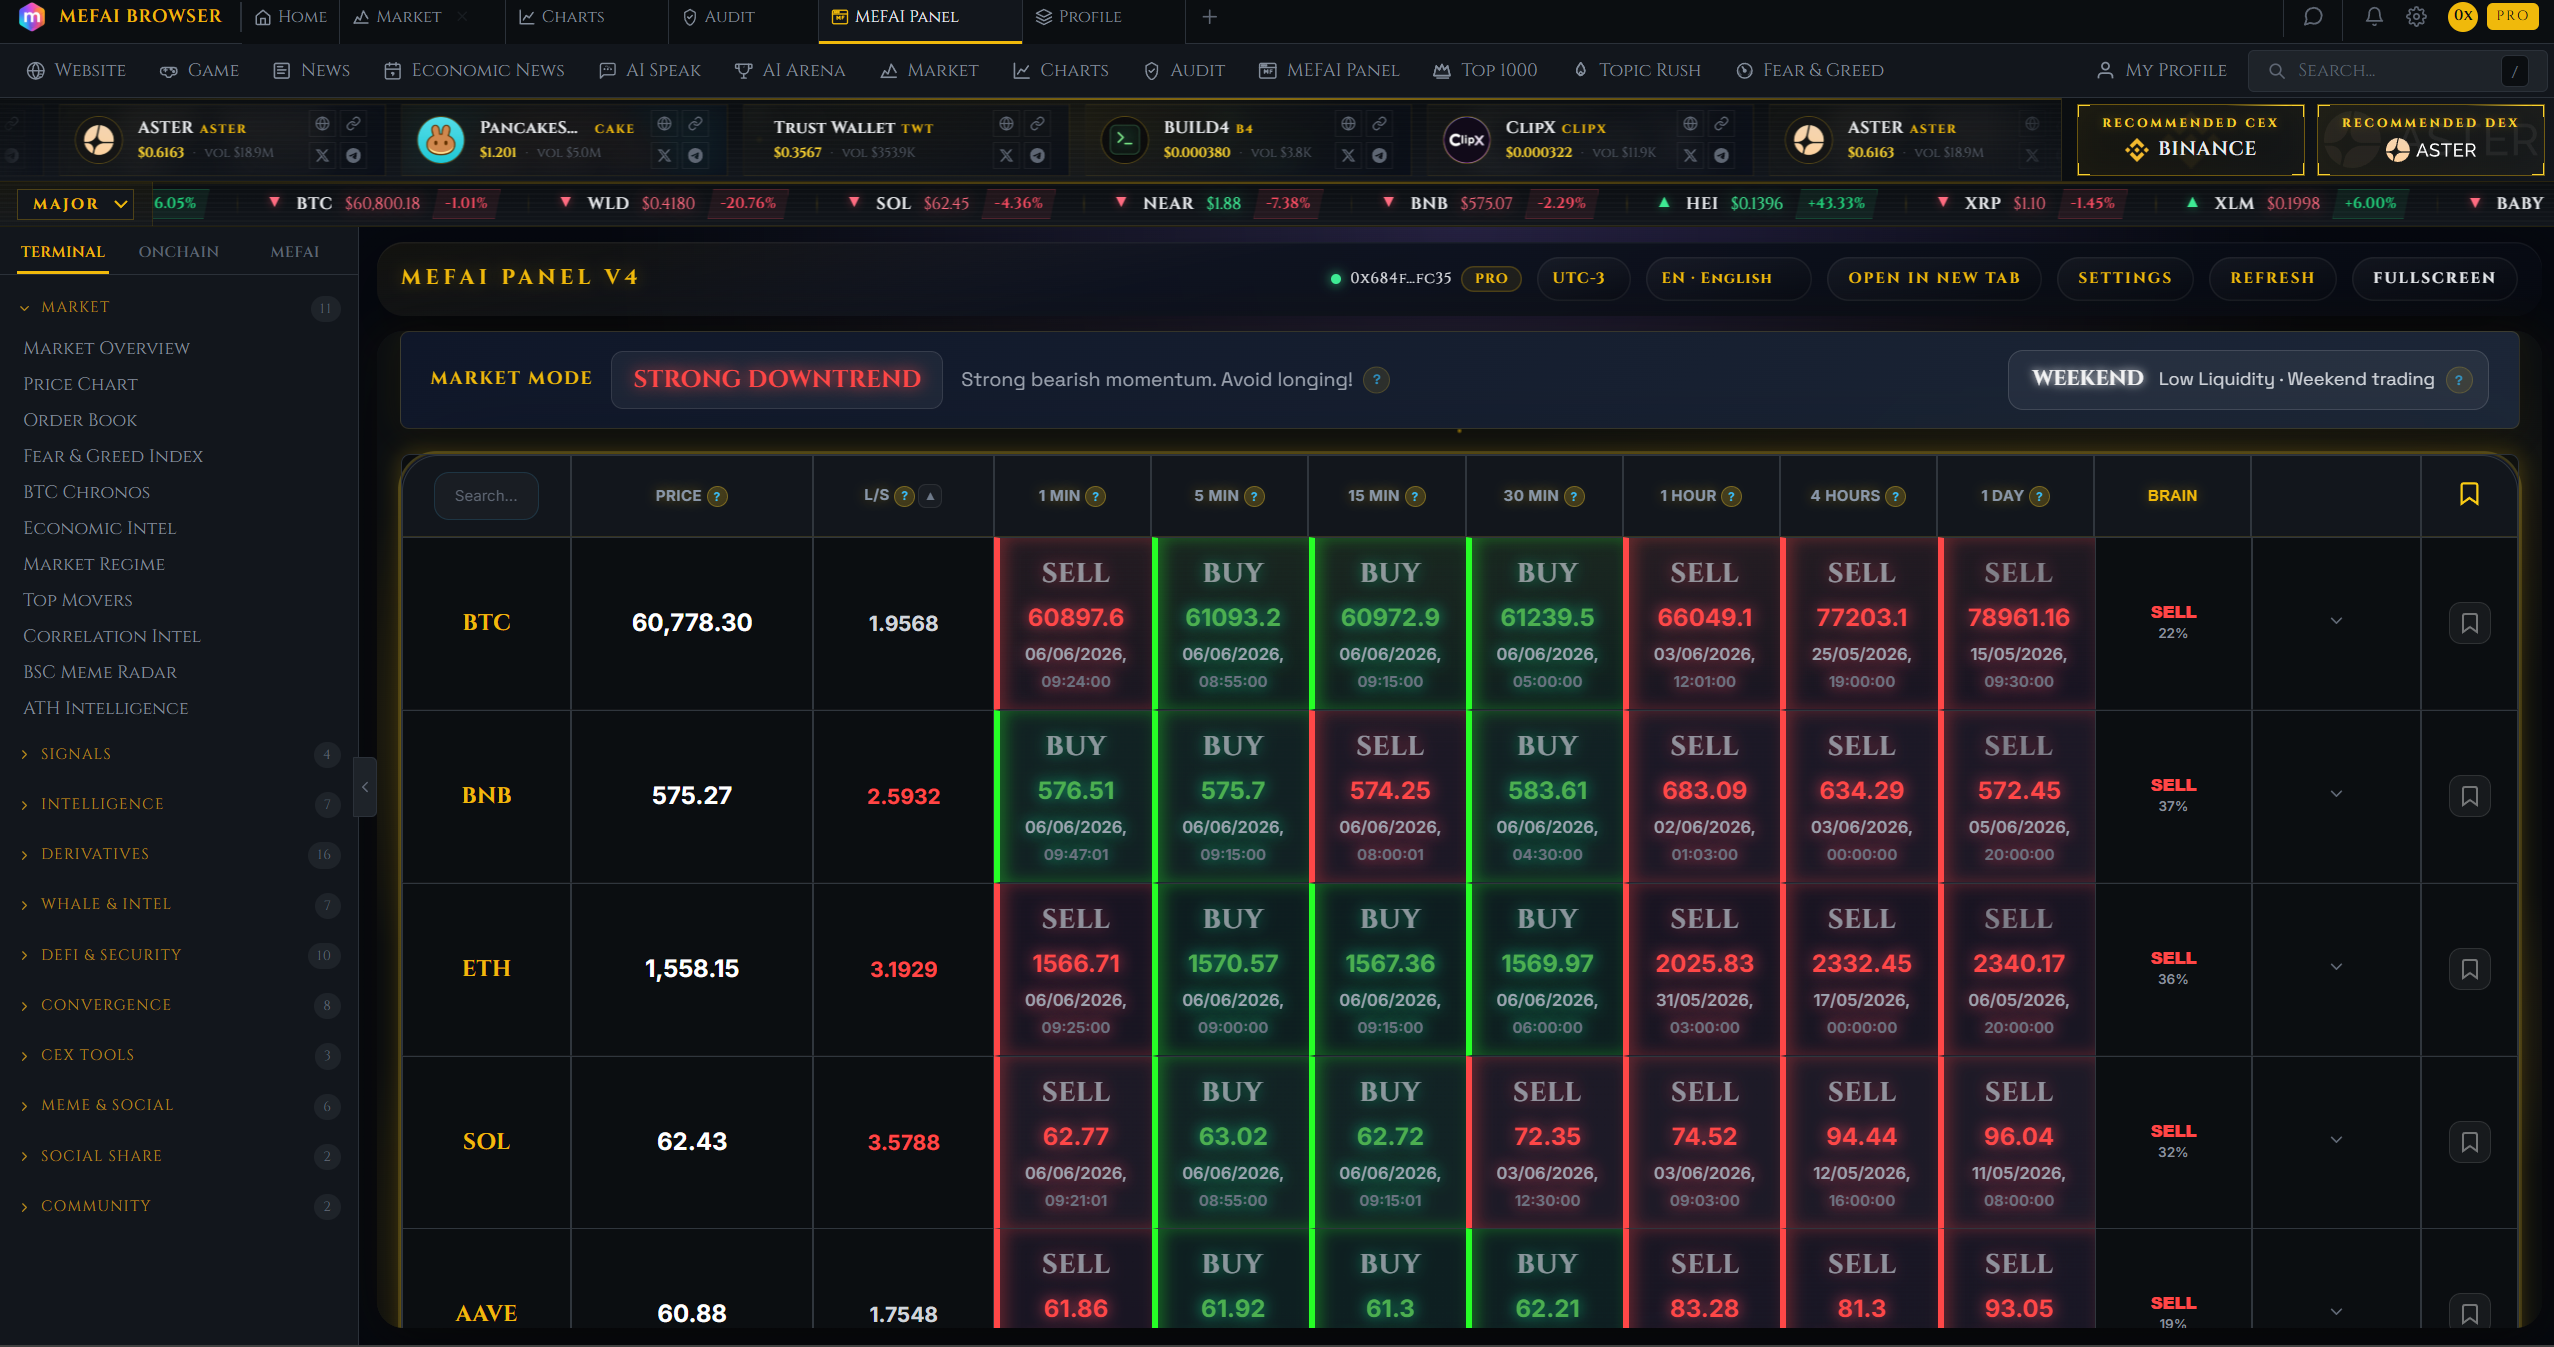

Real results from MEFAI's AI. Get $50 off the Pro plan.
Sponsored · Past performance is not indicative of future results. Not financial advice.

Best funding rate trackers for tracking derivatives sentiment
For funding rate tracking, Bybt (now part of CoinGlass) and Laevitas are popular choices among beginners. Bybt aggregates funding rates across major exchanges and presents them in a clean, sortable table, making it easy to compare rates for Bitcoin, Ethereum, and other major assets. Laevitas offers a more polished interface with historical charts and funding rate trends, which can help you spot when rates are approaching extremes. Both platforms are free to use and do not require registration, which lowers the barrier to entry. When choosing a funding rate tracker, prioritize platforms that show rates in real time and allow you to filter by asset or exchange.
For a more integrated experience, Coinglass combines funding rates, liquidations, and exchange data in one dashboard. Its liquidation heatmap is particularly useful for beginners, as it visually groups liquidations by price level and direction. Coinglass also offers a mobile app, which can help you stay updated during active market hours. Beginners should start by monitoring funding rates for Bitcoin and Ethereum, as these assets have the deepest derivatives markets and the most reliable data. Avoid platforms that require you to switch between multiple tabs or tools to get a full picture of derivatives sentiment.
Liquidation trackers that help you avoid sudden volatility
For liquidation tracking, Bybt and CoinGlass again stand out for their real-time liquidation feeds and clear visualizations. Bybt’s liquidation table shows the size, direction, and price of each liquidation event, which can help you identify clusters around key price levels. CoinGlass enhances this with a heatmap that highlights areas with the highest liquidation density, making it easier to spot potential support or resistance zones. Both platforms update in real time, which is crucial during volatile periods. Beginners should use liquidation data to avoid entering trades near known liquidation clusters, especially in leveraged markets.
Another useful tool is Liquidation Watch, a simple web app that focuses exclusively on liquidations across multiple exchanges. Its clean interface and push notifications make it ideal for beginners who want to monitor liquidations without navigating complex dashboards. When selecting a liquidation tracker, prioritize platforms that allow you to filter by asset, exchange, and time frame. Avoid tools that only show aggregate numbers without context, as the location and timing of liquidations are more important than the total count.
Sentiment tools that cut through the noise
For sentiment analysis, LunarCrush and Santiment are beginner-friendly options. LunarCrush aggregates social media mentions, influencer activity, and price correlations into a single sentiment score, presented in an easy-to-read dashboard. Santiment combines social sentiment with on-chain metrics and project fundamentals, offering a more nuanced view of market psychology. Both platforms offer free tiers, which is ideal for beginners. When using sentiment tools, focus on trends rather than single data points, and always cross-check sentiment readings with price action and on-chain data.
Another option is CryptoPanic, a news aggregator that highlights trending stories and sentiment shifts across multiple sources. Its “Fear & Greed” index is a simple way to gauge overall market sentiment at a glance. Beginners should use sentiment tools as a secondary confirmation rather than a primary signal, as sentiment can be highly reactive and often lags price moves. Look for platforms that provide historical sentiment data so you can compare current levels to past extremes.

How to combine tools into a simple beginner workflow
Start by selecting one on-chain platform, one funding rate tracker, one liquidation tracker, and one sentiment tool. For example, use Glassnode for on-chain data, Bybt for funding rates and liquidations, and LunarCrush for sentiment. Each morning, scan your chosen dashboards for unusual activity: rising active addresses on Glassnode, extreme funding rates on Bybt, large liquidation clusters, or elevated sentiment on LunarCrush. Note any divergences, such as rising on-chain activity but falling sentiment, which could signal a potential trend shift. Use this information to set price alerts on a simple charting app like TradingView, so you’re notified when key levels are tested.
As you become more comfortable, add depth to your analysis by comparing metrics across tools. For example, if liquidations are piling up at a key support level while funding rates are turning negative, it may signal a potential reversal. Conversely, if on-chain activity is rising alongside positive funding rates, it could confirm an uptrend. Avoid the temptation to track too many assets or metrics at once; focus on Bitcoin and Ethereum initially, then expand as you gain confidence. Keep a journal of your observations to track which indicators are most useful for your style and which ones you can safely ignore.
What to watch next as you gain experience
Once you’re comfortable with the basics, explore more advanced on-chain metrics such as realized profit/loss, MVRV ratio, and exchange reserve trends. These metrics can help you identify market tops and bottoms with greater precision. For derivatives traders, dive into open interest trends and basis rates, which reveal shifts in market positioning. Sentiment tools can be expanded to include project-specific metrics, such as developer activity or community growth, to assess long-term potential. As you layer in more advanced tools, always ask whether each new metric adds clarity or just more noise. The goal is to refine your analysis, not complicate it.
Another step forward is automating parts of your workflow. Set up price alerts tied to your liquidation heatmaps or funding rate extremes, so you’re notified when conditions change. Use portfolio trackers like CoinTracker or Koinly to monitor your holdings in one place, and integrate them with your analysis tools to see how your positions align with market trends. Over time, you may also explore scripting or APIs to pull data directly into spreadsheets, which can help you backtest strategies and refine your approach. Remember, the most durable market analysis habits are built on consistency and clarity, not speed or complexity.
Final verdict: start simple, stay consistent, and focus on clarity
For beginners, the best crypto market analysis setup is one that is simple, reliable, and aligned with your goals. Start with a trusted on-chain platform like Glassnode or CryptoQuant to understand real user activity. Pair it with a funding rate tracker such as Bybt or Laevitas to gauge derivatives sentiment, and use CoinGlass or Liquidation Watch to monitor liquidation clusters and potential volatility zones. Add a sentiment tool like LunarCrush or Santiment to keep a pulse on crowd psychology, and use a charting app like TradingView for price alerts and basic analysis. Avoid the temptation to chase every new tool or metric; instead, master a small set of durable indicators that give you a clear picture of market conditions.
The key to long-term success is consistency. Spend 10–15 minutes each day reviewing your chosen dashboards, noting any unusual patterns, and updating your alerts. Over time, you’ll develop an intuition for which signals matter most in different market conditions. As you grow more confident, gradually expand your toolkit and deepen your analysis, but always prioritize clarity over complexity. Market analysis is not about predicting the future; it’s about understanding the present with enough precision to make informed decisions. Start small, stay disciplined, and let the data guide your path.
More in Crypto & Trading

DeFi Compared: Matching the Right Platform to Your Needs
A practical guide to the leading DeFi platforms, who each suits, what they offer, and how to choose based on your goals and risk tolerance.

Why an Anthropic IPO Could Tie Bitcoin Closer to the AI Trade
An Anthropic stock listing would give traders a single AI stock to bet on, tightening bitcoin’s correlation with the AI trade and increasing its sensitivity to Fed policy and risk appetite.

AI Crypto Trading Tools for Beginners: How to Get Started Safely
A no-nonsense beginner’s guide to AI crypto trading tools: what they do, how to start, and which beginner-friendly options to consider first.