
XRP’s 10% Rally Fades: What the Pullback Means for Traders and the Broader Market
By Mag-Info Tech editorial · 2026-06-16

XRP’s latest breakout above $1.20 looked promising on the surface, but the token quickly gave up its gains as traders locked in profits near $1.25. The move underscores how sensitive digital-asset markets remain to short-term supply and demand imbalances, even when the underlying drivers—ETF inflows and Asian demand—appear constructive. For investors watching XRP’s chart, the pullback is a reminder that resistance zones still matter and that a sustained recovery will require clearing higher hurdles around $1.30–$1.32.
A Breakout That Couldn’t Hold
XRP briefly moved past the $1.20 mark that had acted as a ceiling for weeks, a technical milestone that drew fresh attention from both retail and institutional traders. Volume spiked during the ascent, confirming that the breakout had genuine follow-through rather than being a false signal. Yet the momentum stalled just above $1.25, where sellers stepped in and forced the price back down. The inability to hold above $1.25 is a classic sign that the market is still testing whether this level can flip from resistance to support. Until XRP can string together several closes above $1.25 without an immediate retreat, traders will remain cautious about labeling the breakout as durable.
The pullback also highlights the role of profit-taking in short-term rallies. When an asset rises quickly—especially after a prolonged consolidation—traders often take quick gains to lock in returns, which can create sharp reversals. In XRP’s case, the 10% climb in a single session provided ample incentive for early sellers to enter the market, draining upward pressure and shifting focus back to the $1.20 support zone. This dynamic is common across liquid digital assets and underscores why breakout attempts often require follow-through volume to avoid immediate failure.
ETF Flows and Asian Demand as Catalysts
Behind the price action, XRP ETFs recorded a second straight week of inflows, totaling $10.68 million and pushing cumulative inflows to roughly $1.44 billion. These inflows suggest that institutional and retail investors continue to allocate capital to XRP through regulated products, which can provide a steady bid beneath the market. ETF demand is particularly important because it represents “sticky” capital—money that is less likely to vanish during short-term volatility compared with speculative spot trading. The sustained inflow trend supports the view that XRP is gradually attracting longer-term holders, even if the price remains range-bound on shorter timeframes.
Asian demand also played a visible role in the rally. Regional trading desks and over-the-counter desks often lead early moves in XRP due to its use in cross-border payments and remittances across Asia. When liquidity conditions tighten in other regions, Asian flows can provide an early lift, especially during Asian trading hours. The combination of ETF inflows and regional demand created a two-sided momentum that briefly pushed XRP beyond technical resistance. However, the sustainability of such moves depends on whether fresh buyers step in once profit-takers exit, rather than relying solely on short-term demand spikes.
Key Levels Traders Are Watching Now
With XRP back below $1.25, the immediate focus shifts to support and resistance levels that now define the trading range. The $1.20 level has flipped from resistance to potential support after being tested and briefly broken, making it the first line of defense against further declines. A daily close below $1.20 could signal a deeper pullback toward the $1.14–$1.15 range, which served as a prior support area during the early-June consolidation. Traders will watch volume on any dips to $1.20; strong buying interest there would confirm that the breakout attempt is still alive.

On the upside, $1.25 remains the immediate resistance that capped the most recent rally. A decisive close above $1.25 with strong volume would open the door to the next technical target in the $1.30–$1.32 zone. That area has been referenced as a key resistance cluster in recent analysis, and a sustained move through it would likely attract additional algorithmic and institutional interest. Until then, the market remains in a transitional phase where each push toward $1.25 is met with selling, and each dip toward $1.20 is met with buying—creating a classic range-bound environment.
From a risk-management perspective, traders are now calibrating positions around these levels. A break below $1.20 would likely trigger stop-loss orders and prompt some funds to reduce exposure, potentially accelerating a move toward $1.14–$1.15. Conversely, a sustained breakout above $1.25 could draw in momentum traders and algorithmic systems that scale into long positions, potentially extending the rally toward $1.30. The interplay between these levels will dictate whether XRP resumes its upward trajectory or slips back into the pre-breakout consolidation pattern.
What This Means for Different Types of Traders
For short-term traders and scalpers, the current setup offers clear risk parameters: entries above $1.25 with tight stops just below, or entries on a bounce from $1.20 with stops beneath that level. The tight range increases the importance of precise execution, as false breaks can lead to quick losses. These traders benefit from the increased volume and volatility during the $1.20–$1.25 dance, but they must remain disciplined to avoid overleveraging in a choppy environment.
Medium-term investors and ETF holders have a different calculus. For them, the recent price action is less about intraday swings and more about whether XRP can stabilize above $1.20 on a weekly basis. The continued ETF inflows suggest that long-term holders are accumulating, which can dampen the impact of short-term volatility. These investors may use pullbacks near $1.20 as opportunities to add to positions, especially if the broader market sentiment remains constructive. Their focus is on whether the $1.30–$1.32 resistance zone can be challenged over the next several weeks.
Institutional desks and market makers are closely monitoring order flow and liquidity depth around these levels. They often act as liquidity providers during range-bound conditions, buying dips and selling rallies to capture the bid-ask spread. Their presence can help stabilize price action, but it also means that large orders can move the market quickly if sentiment shifts. For these participants, the key is to distinguish between genuine follow-through and exhaustion moves, especially given the increased ETF-driven liquidity.
Technical Indicators and Market Structure
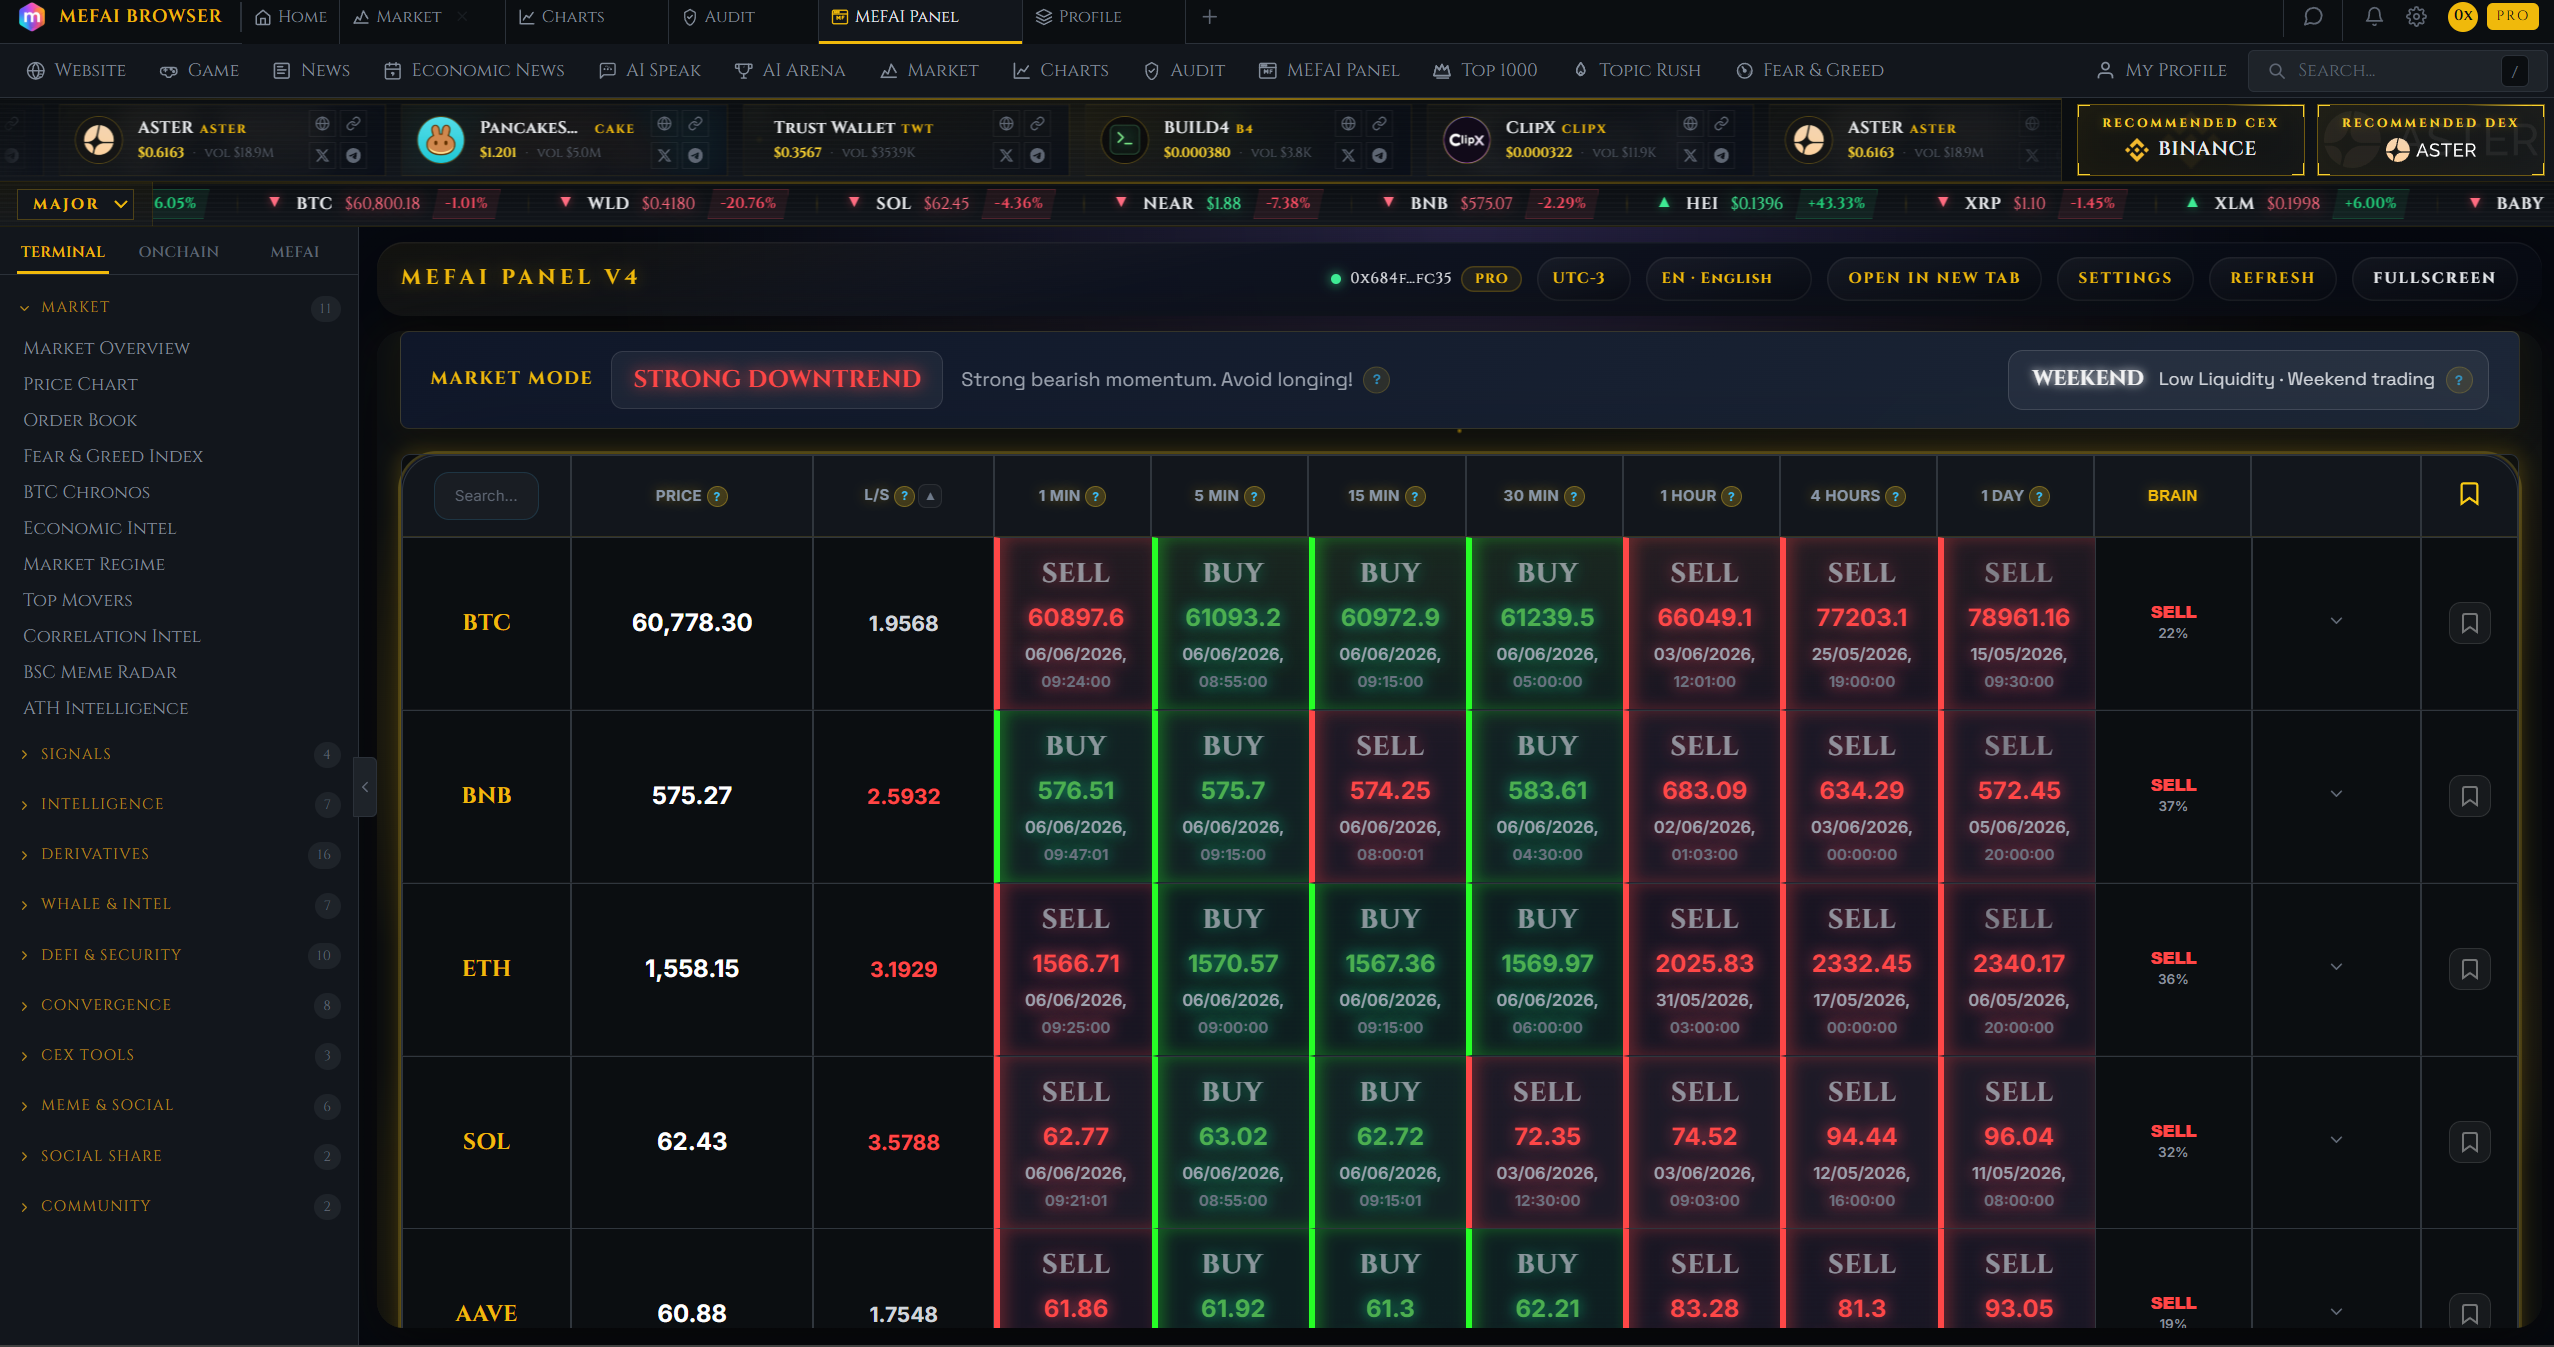

Real results from MEFAI's AI. Get $50 off the Pro plan.
Sponsored · Past performance is not indicative of future results. Not financial advice.
The volume spike during the breakout above $1.20 is a positive sign for bulls, as it indicates that the move had real participation rather than being driven by thin order books. However, the subsequent drop-off in volume during the retreat suggests that the selling pressure was not met with strong buying interest, which is a cautionary signal. Traders often look for volume confirmation on both the breakout and the pullback; in this case, the lack of volume on the decline hints that the market may not yet be ready to sustain a push higher.

From a momentum perspective, indicators such as the Relative Strength Index (RSI) and Moving Average Convergence Divergence (MACD) are likely oscillating around neutral or slightly bullish levels after the rally. These tools help traders gauge whether an asset is overbought or oversold, but they are less reliable in choppy or low-liquidity conditions. In XRP’s case, the indicators may not yet reflect an overbought condition, given that the price is now back within the recent range. This leaves room for another upward push if fresh catalysts emerge, such as regulatory clarity or a broader market rebound.
Market structure also matters. XRP’s liquidity is concentrated on major exchanges, and large orders can still cause slippage, especially during low-volume periods. The fact that the token struggled to hold above $1.25 despite strong ETF inflows suggests that the order book may not be deep enough to absorb sustained buying pressure at this stage. This structural limitation reinforces the importance of the $1.30–$1.32 resistance zone, where liquidity is likely to be more robust and where a true test of bullish conviction would occur.
Regulatory and Adoption Developments to Watch
While the immediate focus is on price action, longer-term drivers such as regulatory clarity and real-world adoption continue to shape XRP’s investment case. Any progress on the legal front—such as ongoing litigation outcomes or clearer guidelines from regulators—can shift market sentiment and attract new capital. Similarly, announcements related to XRP’s use in cross-border payments or partnerships with financial institutions can provide fundamental support for the token’s value proposition.
The ETF inflows are a tangible sign that regulated products are gaining traction, which can reduce perceived risk for traditional investors. As more institutional players gain exposure through ETFs, the correlation between XRP and broader market sentiment may weaken, allowing the token to trade more on its own fundamentals. This development is still in its early stages, but it represents a meaningful shift toward mainstream acceptance.
For traders, staying informed about these macro developments is crucial. Regulatory headlines or adoption news can act as catalysts that override technical levels, creating sudden breakouts or breakdowns. Monitoring news wires and official announcements from Ripple and partner institutions can provide early signals about potential shifts in market dynamics.
Practical Takeaways for XRP Traders and Investors
- Use the $1.20–$1.25 range as your primary reference. Treat $1.20 as support to watch for bounce entries and $1.25 as resistance to watch for breakout attempts. Tight stops and disciplined position sizing are essential in this environment.

-
Watch volume on any breakout attempts. A move above $1.25 needs strong, sustained volume to confirm that the breakout is genuine. Without it, the risk of a quick reversal remains high.
-
Consider ETF flows as a supporting factor. Continued inflows into XRP ETFs can provide a floor under the market during pullbacks, but they are not a guarantee against short-term volatility.
-
Be prepared for choppy price action. Until XRP clears $1.30–$1.32 on a sustained basis, expect range-bound trading with frequent tests of key levels. Avoid overleveraging in such conditions.
-
Monitor broader market sentiment. While XRP is showing signs of independent strength, it is still influenced by Bitcoin’s price action and overall crypto market trends. A major downturn in Bitcoin could pressure XRP despite its positive developments.
What Comes Next?
The next 7–14 days will be critical for XRP. If buyers can defend $1.20 and push the price back toward $1.25 with volume, the odds of a sustained breakout improve. Conversely, a failure to hold $1.20 could lead to a retest of the $1.14–$1.15 support area, which would likely attract fresh buying interest from long-term holders.
For now, the market is in a holding pattern, waiting for a catalyst to break the current equilibrium. Whether that catalyst comes from technical factors—such as a clean break above $1.25—or from external developments—such as regulatory news or adoption updates—remains to be seen. Traders should remain flexible, focus on risk management, and avoid assuming that the recent breakout attempt guarantees a new upward trend. The path forward will be defined by how well XRP can consolidate above $1.20 and whether it can generate enough momentum to clear the next resistance cluster.
More in Crypto & Trading
Crypto Money Makes Its Mark: $12 Million Boosts Alabama Senate Hopeful to November
A crypto-focused political action committee poured over $12 million into Barry Moore’s Alabama Senate run, propelling him to a primary win and spotlighting crypto’s growing influence in U.S. politics.

Bitcoin’s Sharpe Ratio Flashes Cycle-Low Signal as Holders Absorb 125,000 BTC
Bitcoin’s risk-adjusted return metric has hit a level that has marked every bear-market bottom since 2015, but history shows it precedes months of range-bound trading rather than an immediate rebound.

Illinois’ 0.2 % Crypto Transaction Tax: What Residents and Businesses Need to Know
Illinois will levy a 0.2 % tax on every crypto trade starting 1 Jan 2027, the first broad state tax on digital-asset transactions regardless of profit, and it applies even if you trade on out-of-state