
Bitcoin’s Next Move: Why $59,000 Is the Line in the Sand as Liquidity Fades
By Mag-Info Tech editorial · 2026-06-24

Bitcoin’s tight summer range hides growing downside risk
Bitcoin is trading inside a narrow band that suggests limited immediate volatility, but beneath the surface, market conditions are deteriorating. A leading digital-asset trading firm’s options desk now projects Bitcoin could fall to $59,000 in the coming days as liquidity thins and price swings compress. The forecast comes from a one-day straddle derived from options pricing, which places Bitcoin in a $61,242 to $63,563 range for the next 24 hours. That implies expected price movement of just 1.9%, a sign that traders expect calm—but calm in thin markets can flip quickly into sharp moves when sentiment shifts. Ether is similarly constrained, with a projected range of $1,606 to $1,694, reflecting a broader stall across major tokens.
The apparent stability is deceptive. Market makers and algorithmic desks often reduce risk exposure during summer months, when trading volumes drop and price dislocations become harder to hedge. When liquidity evaporates, even modest selling can push prices through key levels faster than during busier periods. The warning from Wintermute’s desk is not a forecast of a crash, but a signal that the cushion under Bitcoin’s current price is thinning. Traders should treat the $59,000 level not as a speculative target, but as a critical support that, if breached, could accelerate selling pressure across correlated assets.
Rising token correlations signal a market losing its footing
Another red flag is the increase in cross-token correlation, which now sits near multi-month highs. When Bitcoin, Ether, and major altcoins move in lockstep, it usually reflects a lack of fresh capital entering the market and a retreat from idiosyncratic trading strategies. Instead of individual tokens responding to unique catalysts—such as network upgrades, earnings, or regulatory news—traders are treating the entire sector as a single asset class. That behavior is typical in late-cycle or low-liquidity environments, where investors reduce discretionary bets and focus on broad directional exposure.
Rising correlation also weakens the diversification argument that many investors use to justify crypto allocations. If all tokens fall together during a liquidity squeeze, portfolios that were supposed to be balanced may behave like a single risky asset. This dynamic can trigger stop-loss cascades and force leveraged positions to unwind, amplifying downside moves. For retail and institutional traders alike, the lesson is clear: in a high-correlation regime, risk management must be more conservative, with tighter position sizing and clearer exit rules.

Summer doldrums compound the liquidity squeeze
Seasonal trends are playing a role in the current environment. Summer months historically see lower trading volumes across equities, forex, and crypto, as key decision-makers take vacations and institutional desks operate with skeleton crews. This year, the effect is compounded by the absence of fresh institutional inflows from spot Bitcoin ETFs, which had been a reliable source of demand since their launch. Without new ETF bid, the market is increasingly reliant on retail flows and derivative positioning, both of which are more sensitive to sentiment shifts.
The lack of fresh ETF demand also removes a key buffer against volatility. ETFs absorb buying and selling pressure through authorized participants who create or redeem shares, effectively stabilizing prices during moderate stress. When ETF flows stall, that stabilizing mechanism weakens, leaving the market more exposed to speculative swings. Traders should expect wider intraday ranges and slower recovery times during any pullback, as fewer buyers step in to absorb selling pressure.
The $59,000 level is more than a price—it’s a sentiment gauge
The $59,000 level carries psychological weight beyond its numerical value. It has been cited by market makers as the “bear market low,” a line in the sand that, if broken, could shift sentiment from cautious optimism to outright caution. In technical terms, $59,000 aligns with previous cycle lows and key moving averages, making it a natural magnet for both stop-loss orders and bargain hunters. But in the current environment, the balance appears tilted toward sellers.
If Bitcoin breaks below $59,000, the next visible support cluster sits around $57,000 to $57,500, based on recent consolidation zones. However, the real risk is not the next price level, but the absence of liquidity to cushion a fall. In thin markets, price gaps can emerge between exchange order books, and slippage can exceed 2% even on relatively small orders. Traders should review their liquidity sources now—ensuring they have access to multiple exchanges, over-the-counter desks, and derivative platforms—before any volatility spike.
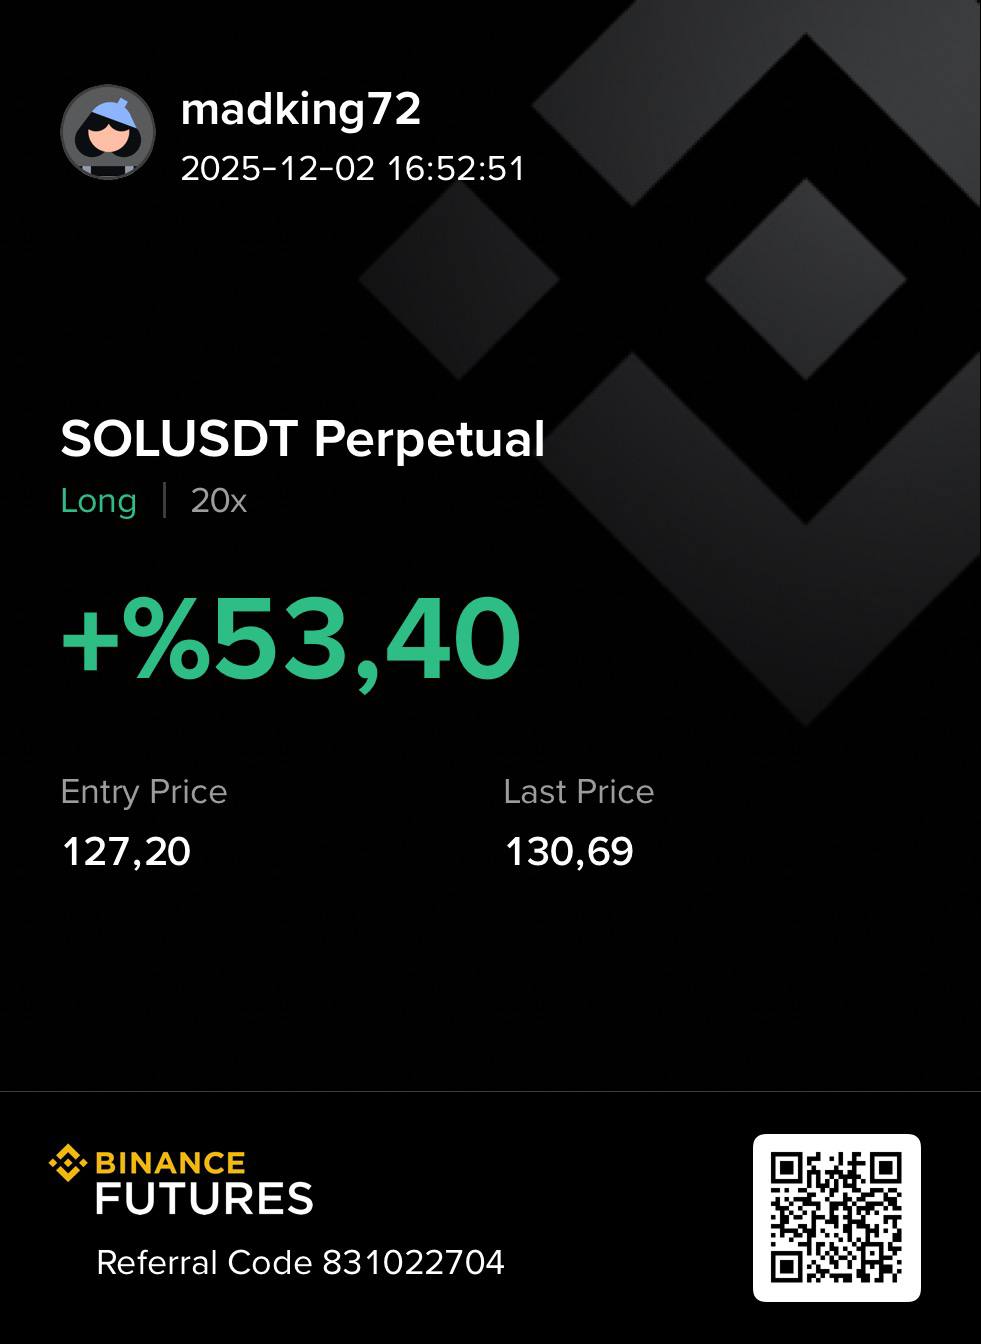

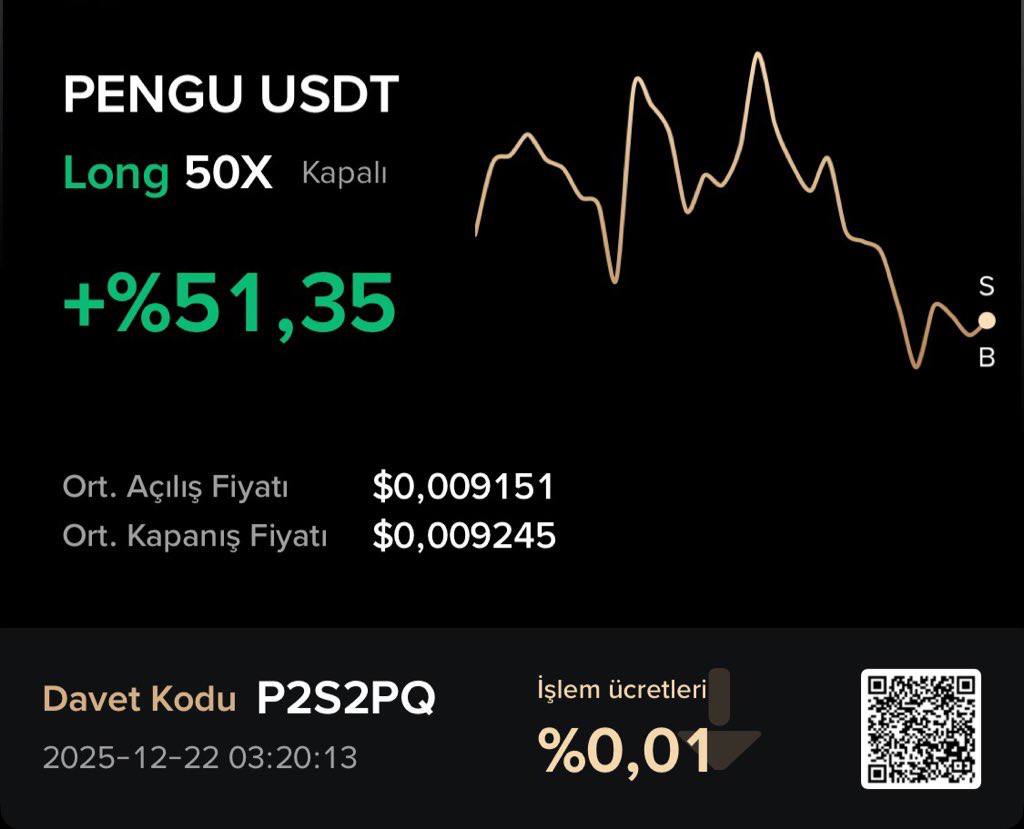
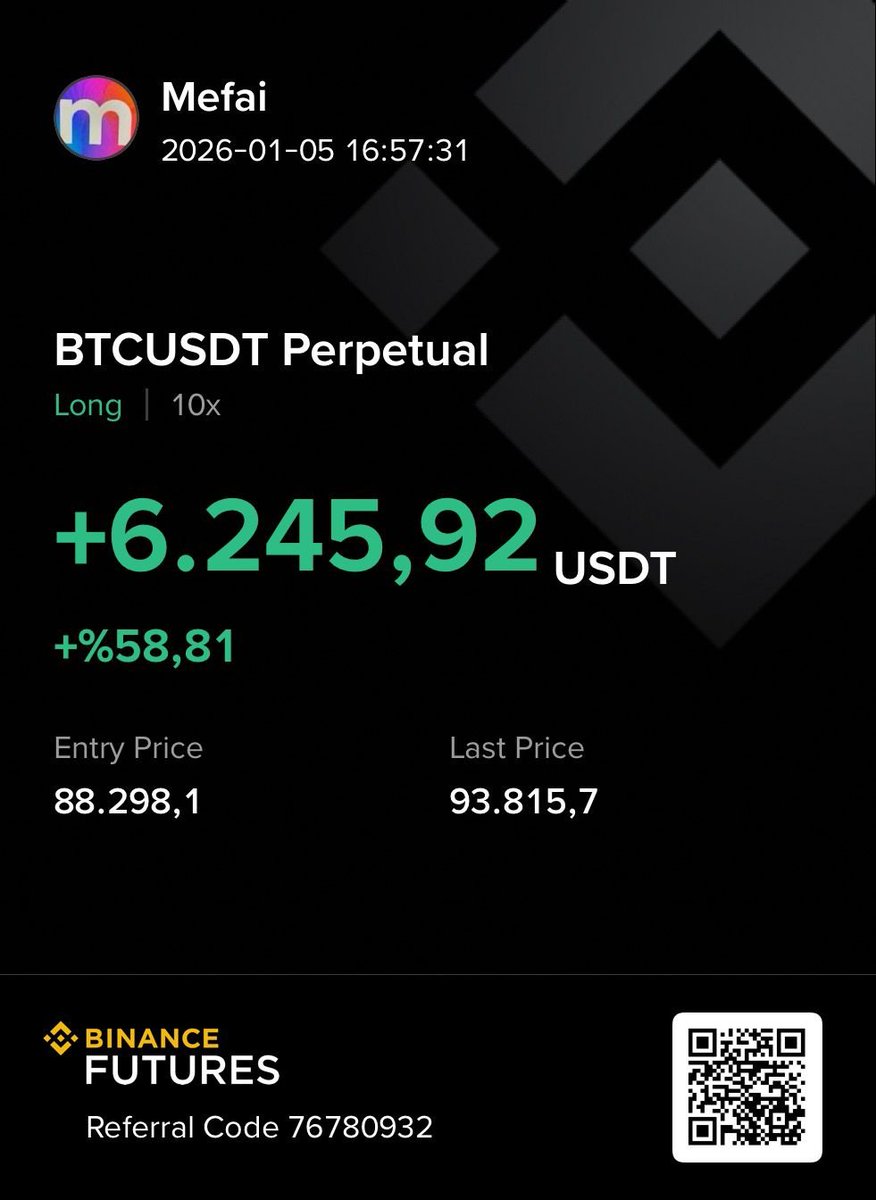
Real results from MEFAI's AI. Get $50 off the Pro plan.
Sponsored · Past performance is not indicative of future results. Not financial advice.

Derivatives market shows complacency, not confidence
Options pricing suggests traders are pricing in low volatility, but low implied volatility often precedes volatility expansion, not stability. The one-day straddle used by Wintermute implies expected moves of less than 2% for Bitcoin and under 3% for Ether, which is unusually tight for an asset class known for sudden swings. Low implied volatility typically reflects either a lack of catalysts or a market that has priced in all known risks—neither of which appears to be the case here.
The derivatives market’s complacency is particularly notable given the macro backdrop: a hawkish Federal Reserve stance, geopolitical uncertainty, and the absence of new ETF inflows. These are not conditions traditionally associated with low volatility. Instead, they point to a market that is underpricing tail risk. Traders who rely on options for hedging should consider increasing their downside protection, while those using options for leverage should reduce position sizes to account for the elevated risk of a sharp move.
What to watch next: catalysts and liquidity signals
The most immediate catalyst to watch is the next wave of institutional flows. Spot Bitcoin ETFs have paused their net inflows in recent sessions, and any resumption would provide a clear signal that the market is regaining its footing. Conversely, continued outflows or flat volumes would confirm that the summer doldrums are deepening. Beyond ETFs, watch for regulatory developments, particularly in the United States, where legislative activity around digital assets can shift market sentiment overnight.
Another critical indicator is order book depth across major exchanges. Thin order books—visible as wide gaps between bid and ask prices or shallow depth at key levels—are early warning signs of liquidity stress. Traders can monitor real-time order book metrics on platforms that provide Level 2 data, and adjust their execution strategies accordingly. If depth continues to decline, expect increased slippage and slower trade execution during volatility events.

Practical steps for traders in a low-liquidity environment
For short-term traders, the priority is risk control. Tighten stop-loss thresholds and avoid overleveraging, especially in derivatives markets where liquidations can occur rapidly. Consider breaking larger orders into smaller batches and using limit orders rather than market orders to reduce slippage risk. For longer-term holders, the summer lull may present an opportunity to reassess allocations, but only after confirming that liquidity conditions have stabilized.
Institutional desks should review their counterparty exposure and ensure they have access to multiple liquidity providers. Relying on a single market maker or exchange during low-liquidity periods increases settlement risk and can lead to delays in executing large orders. Diversifying execution venues and maintaining relationships with OTC desks can mitigate these risks.
The big picture: patience or preparation?
Bitcoin’s current range-bound trading is not a sign of health, but of exhaustion. The market is caught between macro headwinds and a lack of fresh capital, with liquidity draining as summer begins. The $59,000 level is not just a price—it’s a test of whether the market can hold its ground without institutional support. A break below it would likely accelerate selling, while a bounce back toward $64,000 could restore some confidence, at least temporarily.
For now, traders should prepare for volatility rather than expect stability. The tools are available—tighter risk controls, diversified execution, and closer monitoring of liquidity signals—but the willingness to use them will determine who navigates the next move successfully. The summer may be quiet, but in crypto, quiet markets are often the calm before the storm.
More in Crypto & Trading

Bitcoin Sinks Toward $62,000 as Tech Selloff Extends Crypto’s Weekly Slide
Bitcoin is down nearly 5% this week as a semiconductor rout pulls risk assets lower, with ether and memecoins falling faster and U.S. spot bitcoin ETFs posting record outflows.

Senate Democrats Call for Hearings on $500 Million UAE Crypto Deal Tied to Trump Family
US Senate Democrats demand hearings into a reported $500 million investment by UAE royalty into Trump family’s crypto firm, raising national security and conflict-of-interest concerns.
Bitcoin Slides to $63,000 as Tech Selloff Tests Crypto’s Link to Stocks
Bitcoin fell toward $63,000 while ether dropped 3.3% this week as a tech stock rout pulled risk assets lower, signaling growing correlation between crypto and equities.